Showing posts with label US nonfarm payrolls. Show all posts

Friday, May 6, 2011

Top 5 Economics Graphs of the Week - 7 May 2011

This week we take a look at the Purchasing Manager Index data for the US and China. Then there's a review of the US employment report, before an overview of the employment data from New Zealand, we then wrap up with a review of some of the key monetary policy decisions over the past week.

1. US PMI
The US recorded some relatively disappointing numbers, with the manufacturing PMI falling to 60.4 from 61.2 and the non-manufacturing PMI falling to 52.8 from 57.3. Sure both numbers were still in positive territory, and both still in the expansionary indicator space. But much of the weakness was in the wrong spots, e.g. things like non-manufacturing PMI falling -11.4 points, and new export orders also falling -5.5 points and business activity -6 points. While the manufacturing index saw negatives in production -5.2 points and -1.6 on new orders. However within the manufacturing PMI, there was a 8.5 point increase in backlogs and a 6 point increase in new export orders which are both interesting positives that should point to at least a short term continuation of momentum in manufacturing.
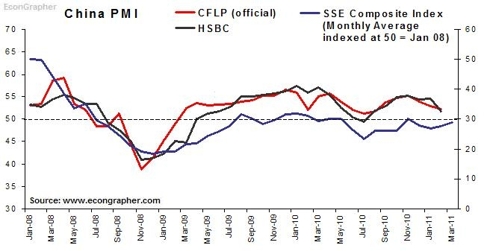
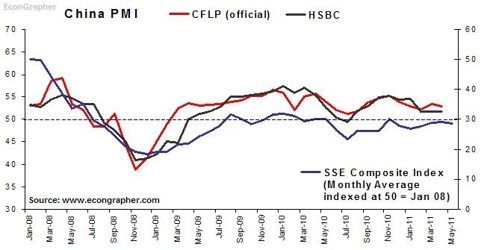
2. China PMI
The official CFLP manufacturing PMI came in at 52.9 in April, down slightly from 53.4 in March, and below the Bloomberg consensus of 53.9. The preliminary HSBC/Markit reading was 51.8, the same as the March reading. The readings show the manufacturing sector in China still in expansionary mode, which bodes well for the Chinese economy. But it could well herald another move by the People's Bank of China, particularly given recent comments that it will continue to fight inflation. Next week is China's monthly data release, where inflation is likely to moderate compared to March's 5.4% reading, but it could be an opportune time for the People's Bank of China to do one last interest rate increase.

3. US Nonfarm Payrolls
The US added 244k nonfarm payrolls in April, up slightly versus March's 221k, and compares to 277k in April 2010. The figure brings 2011 net new nonfarm payrolls to 768k YTD. Less meaningfully, the unemployment rate rose slightly to 9.0% from 8.8% in March. So, all up it was a reasonably positive result. The US economy is finally starting to see consistency in jobs added, and this area will likely be a key aspect for a recovery in consumer spending, and thus a key factor in the housing market, as well as general inflation levels. It's likely that job growth will continue to expand in the months ahead, but as identified in the PMI results, there are due downside risks to the US economy, and an early peak in the PMI could well be negative for the jobs outlook.

4. New Zealand Employment Data
New Zealand reported a 30k increase in jobs through the first quarter of this year, with 20k being part time jobs and 10k being full time. The unemployment rate eased slightly to 6.6%, down from 6.7% in Q4 2010, and off of the peak of 7% in Q4 2009. The employment picture in New Zealand is slowly improving, albeit with the negative contribution from the Christchurch earthquake. But with the rugby world cup event soon approaching there should be a noticeable pick up in part-time jobs, at least in the medium term. After that it's more about how the broader economy can gain momentum and leverage off loose monetary policy, high terms of trade, and one-off boosts. The downside is the need for fiscal tightening, with the government likely to announce a more prudent budget in the next couple of weeks as it seeks to sure up government finances and maintain its AA+ credit rating.

5. Monetary Policy Review
On the monetary policy front, the past week was characterized by continued emerging market policy tightening, and continued developed market policy caution. Of the central banks that made decisions on monetary policy settings this week, those that increased were: India +50bps to 7.25%, Philippines +25bps to 4.50%, and Malaysia +25bps to 3.00%. Meanwhile those that held rates were: Australia 4.75%, Romania 6.25%, United Kingdom 0.50%, European Union 1.25%, and the Czech Republic 0.75%. Next week there's interest rate decisions from Poland (11 May) currently 4.00% , Norway (12th May) currently 2.00%, South Africa (12th) currently 5.50%, and South Korea (13th May) currently 3.00%. Most of these banks will probably increase or maintain a hawkish stance.

Summary

So we saw some relatively disappointing PMI results from the US, but with some glimmers of strength still showing through in the manufacturing index. Over in China there was a slight weakening, but generally things were still strong - perhaps allowing scope for another interest rate increase. Meanwhile the US reported a good nonfarm payrolls figure in April, with some promise for continued strength. Over to New Zealand, the March quarter saw a decent employment report, with a positive outlook as the New Zealand economy looks set to gain momentum. On monetary policy the theme of emerging market tightening continued, and is likely to continue for the time being, meanwhile the overriding theme for developed market central banks was policy caution.

Sources
1. US Institute for Supply Management www.ism.ws & Yahoo Finance finance.yahoo.com
2.
CFLP www.chinawuliu.com.cn & Markit/HSBC www.markiteconomics.com & Yahoo Finance finance.yahoo.com
3. Bureau of Labour Statistics www.bls.gov
4. Statistics New Zealand www.stats.govt.nz
5. CentralBankNews.info www.centralbanknews.info


Article Source: http://www.econgrapher.com/top5graphs7may11.html

Saturday, March 5, 2011

Top 5 Economics Graphs of the Week - 6 Mar 2011

This week we look at the PMI results from the US and China, with some similar patterns and interesting conclusions. Then we review Australian GDP, finding some mixed signals, followed by a look at the recent US nonfarm payrolls report. Finally we wrap up with a review of some particularly interesting monetary policy decisions over the past week.

1. China PMI
China's February PMI readings showed a few seasonal quirks, but also pointed to rising inflationary pressures. The official CFLP PMI was 52.2 vs 52.9 prev, and the HSBC index was 51.7 vs 54.5. Though both indexes fell, they remained above 50 and generally did not point to any significant slowdown. The key warning signal that did come out of the numbers was for further upside inflation risks. The HSBC "Input Prices" sub-index came in at 74.6 vs 71 in January, as rising commodity prices put increasing upward pressure on prices in China and other emerging markets. The HSBC index also showed a rise in the backlogs of work, with rising capacity constraints showing through.

2. US PMI
The U.S. impressed once again with its manufacturing Purchasing Managers Index results. The main PMI index crept up a further 0.6 to 61.4, the highest level since the early 1980's. New orders added 0.2 to 68.0 and the employment sub-index added 2.8 to 64.5 as more employers signaled higher staff (a net 26% expect higher employment). On the non-manufacturing side, the NMI rose to 59.7 from 59.4, with the standouts being business activity +2.3, inventories +6.5, and most interestingly, new export orders +3 points to 56.5 (compared to the imports index at 53.4). Both indexes signalled rising cost pressures with the NMI prices sub-index up 1.2 to 73.3, and the PMI prices sub-index up 0.5 to 82 - showing that inflation is not dead.ff

3. Australian GDP
The Australian economy produced a solid yet uninspiring GDP result for the final quarter of 2010. The Aussie economy expanded at a q/q growth rate of +0.7% (or 2.8% annualized), placing y/y growth at +2.7%. The majority of the growth came from inventory-building, with net exports neutral, and an insipid contribution from consumption. Thus the Australian economy appears to be passing through the hard part of its recession-free recovery. The outlook for the Australian economy is relatively strong growth - perhaps about 3%, and it's likely that any further tightening from the RBA will be pushed out well into the second half of this year.

4. US Nonfarm payrolls
The US recorded a bumper month, by recent standards, in February with 192k jobs added (compared to 36k in January). Private payrolls were up 222k, compared to 50k in Jan. The unemployment rate fell slightly to 8.9% - which is not that meaningful in the scheme of things. Average hourly earnings were flat, as was the average workweek. Thus overall it was a decent result in terms of the number of jobs added, sure some of it was January hiring being pushed into Feb, but a few more months like this would start to make a difference. As it stands, payrolls are still down a net -7.47 million since the start of 2008, so yeah, still a long way to go (oh and since January 2000, payrolls are net negative by about 30k, so who knows - next month could mark the start of a net positive number!).

5. Monetary Policy
In monetary policy the main standout for the week had to be the ECB's tough talking, and rhetoric that hinted at an impending rate hike - perhaps as soon as April. The other big one was Brazil tightening another 50bps, sending the Selic rate to 11.75% as it seeks to rein in rising inflation. Likewise Azerbaijan +200bps, Tajikistan +75bps, and the Dominican Republic +100bps also lifted rates to stave off rising inflation, driven by a spike in food and energy prices. So the usual theme of rising commodity prices and emerging market inflation was highlighted again - but the interesting part was the developed markets story. The European Central Bank specifically noted its concerns about the second round effects of rising commodity prices; so again, inflation is not dead...

Summary

So we saw China put out lower PMI figures, pointing to what will most likely be a temporary tapering off of activity, but more importantly; signaling rising inflationary pressures. Over to the US there was a much more positive PMI result, with some promising signs of strength in activity levels, but the costs pressures signals were also there. In Australia the economy is chugging along as per usual, though the 2010 Q4 results, though positive, were a little less inspiring. Back to the US, the February payrolls figure was a strong one, but there's still a lot more work to be done to get back even close to normal. Meanwhile in monetary policy, the ECB sent strong signals about and impending rate hike, and emerging markets, including one of the BRIC economies, continued to lift interest rates in response to their not-so-unique rising inflationary pressures situation.

Sources
1. CFLP www.chinawuliu.com.cn & Markit/HSBC www.markiteconomics.com & Yahoo Finance finance.yahoo.com
2. Institute for Supply Management www.ism.ws
3. Australian Bureau of Statistics www.abs.gov.au
4. Bureau of Labor Statistics www.bls.gov
5. CentralBankNews.info www.centralbanknews.info


Article Source: http://www.econgrapher.com/top5graphs6mar11.html

Wednesday, February 23, 2011

US Housing and Consumer Confidence Update

While the US saw further improvement in the Consumer Confidence numbers, the same could not be said about the housing market data. The influential S&P/Case Shiller house price index registered a monthly decline of -0.4% in December 2010, and an annual decline of -2.4%, extending a 6 month string of monthly drops in the 20-city index. The numbers just go to show that even though the rest of the US economy is starting to show more and more signs of life, the housing market still has some ground to cover - indeed while the US consumer continues the deleveraging cycle, it's hard to see credible upside potential for house prices in the near term.


But its not all doom and gloom, as noted the US saw further improvement in the Consumer Confidence numbers (conference board). "The Index now stands at 70.4 (1985=100), up from 64.8 in January. The Present Situation Index improved to 33.4 from 31.1. The Expectations Index increased to 95.1 from 87.3 last month." So, much of the strength came from the jump in the expectations index - so people are starting to feel a little more optimistic which is always a good thing. However the employment situation is still weighing on people's minds - as is clearly seen in the chart below. With unemployment slightly improved, yet still at 9% (or higher depending how you count it!), people are still feeling wary about the present situation.


Looking forward there are a number of indicators that point to a strengthening US economy in the year ahead. Fiscal and monetary policy are way loose, and are likely to stay as such for the near term; the PMI indexes show momentum in the economy, especially the new orders index; a lot of businesses are still sitting on large piles of cash, and so-on. So on the outlook, property prices will likely continue to stagnate, unemployment will likely continue to fall (or at least there will be positive jobs growth), and consumer confidence is likely to gradually improve. But of course there are still plenty of downside risks - both internal and external to the US, so tread carefully...

Sources
Econ Grapher Analytics www.econgrapher.com
Conference Board www.conference-board.org
Standard & Poors www.standardandpoors.com
Bureau of Labour Statistics www.bls.gov

Article Source: http://www.econgrapher.com/23feb11-ushousecon.html

Friday, January 7, 2011

Top 5 Economics Graphs of the Week - 8 Jan 2011

This week we examine the US PMI results, US nonfarm payrolls, US equity and bond mutual fund flows trends, EU inflation and growth stats, and a review of monetary policy developments over the past week.

1. US PMI
The US had two good results, the manufacturing PMI increased to 57 from 56.6 (driven by strong new orders, production, and prices), and the non-manufacturing shot up to 57.1 from 55 (driven by new orders, business activity, and prices). The new orders part of the results was a cracker, with both sub-indices above 60), showing there may be a bit of momentum to come. Another interesting aspect of the releases was the increase in the price indexes: inflation? And the other notable was a small decline in both of the indexes' employment sub-indexes, which lines up with the good but not great NFP figure below.

2. US Nonfarm Payrolls
As noted, the figure came in a little lower than expected, and not really high enough to pull down the real unemployment rate. The figure was 103k jobs added, + upward revisions in Nov/Oct of about 70k. The unemployment rate went down to 9.4%, but not a good thing because it was participation rate driven (i.e. people who are becoming discouraged and pulling out of the labor force). So a good but not great result, this year should bring more job growth than last year as the recovery picks up (or as conditions normalize).

3. US Mutual Fund Flows
The story of 2010 mutual fund flows was a steady stream of net inflows into bond funds, with pretty lackluster flows for equity funds. But the worm may be turning, November saw the worst month in the year for bond fund flows, and a slight positive for equity funds. What's more, the weekly data through December (Dec monthly data not out yet) showed about -13 billion for bonds and about positive 5 billion for equity fund flows. So does this herald a trend of re-risking? Will we start to see the money go round reverse? ... Will equity flows beat bond flows this year? and of course what will this mean for the stock market?

4. EU Growth and Inflation
The EU finalized its GDP numbers for Q3, and released the first estimate of inflation for December, with both results being steady. It's likely both the GDP growth rate and inflation rate will muddle along at a subdued pace. But of course, the key risk for the EU is the "PIIGS", the Swiss National Bank has said it wont take Sovereign debt from Portugal or Ireland as collateral anymore, and well basically none of the problems have gone or even eased yet. So this remains a key risk for 2011. Oh and the ECB meets next week.

5. Monetary Policy Review
In monetary policy, Indonesia and Romania held, Peru raised rate 25bps, Bosnia reduced its RRR, and Chile announced currency intervention moves. But the real interesting development in monetary policy is the commodity story for 2011 - food prices remain high due to supply constraints (as well as some weather impacts), and energy is staging a cyclical rebound, pair that with fast growth in emerging markets and you have a real challenge for monetary policy setters in 2011. So, watch this space!

Summary

So we saw some pretty good PMI results in the US for December, which show that there is a bit of momentum in the US economy. The payrolls figure was good but not great; which may well be the theme for 2011. US mutual fund flows data pointed to a possible reversal of dominance from bond to equity funds for 2011. Over in the EU, conditions are on track but subdued, but of course there are still some relatively concerning risks bubbling away there. And on the monetary policy front, commodities and fast growing emerging markets are set to make this an "interesting" year for monetary policy makers.

Sources
1. US Institute for Supply Management www.ism.ws & Yahoo Finance finance.yahoo.com
2. US Bureau of Labor Statistics www.bls.gov
3. US Investment Company Institute www.ici.org
4. Trading Economics www.tradingeconomics.com
5. CentralBankNews.info www.centralbanknews.info


Article Source: http://www.econgrapher.com/top5graphs8jan11.html

Sunday, January 2, 2011

Economic Calendar - 2 January 2011

Here's the Economic Calendar for the week commencing the 2nd of January 2011. Welcome to 2011, may it be a year of health, success and prosperity for you! And what better way to start the first week of 2011 than a look at some of the upcoming economic events! This week there's December PMI figures out from the US, and most EU economies, there's also initial estimates on EU CPI - as well as the final estimate of Q3 GDP. And of course one of the main events will be the US nonfarm payrolls report on Friday (with similar data due from Canada).

(More commentary follows the table)

Date GMT Country/
Currency
Event Forecast Previous
MON 08:45 EUR Italian PMI Manufacturing (DEC) 52.20 52.00
MON 08:50 EUR French PMI Manufacturing (DEC F) 56.30 56.30
MON 08:55 EUR German PMI Manufacturing (DEC F) 60.90 60.90
MON 09:00 EUR Euro-Zone PMI Manufacturing (DEC F) 56.80 56.80
MON 15:00 USD ISM Manufacturing (DEC) 57.00 56.60
MON 15:00 USD ISM Prices Paid (DEC) 71.30 69.50
TUE 09:30 GBP Purchasing Manager Index Manufacturing (DEC) 57.40 58.00
TUE 10:00 EUR Euro-Zone CPI Estimate (YoY) (DEC) 2.00% 1.90%
TUE 15:00 USD Factory Orders (NOV) -0.20% -0.90%
TUE 19:00 USD Fed Releases Minutes - Dec 14 FOMC Meeting

TUE 22:00 USD ABC Consumer Confidence (JAN 2)

WED 10:00 EUR Euro-Zone Industrial New Orders (YoY) (OCT) 18.80% 13.40%
WED 10:00 EUR Euro-Zone Industrial New Orders (MoM) (OCT) 1.50% -3.80%
WED 10:00 EUR Euro-Zone Producer Price Index (MoM) (NOV) 0.30% 0.40%
WED 10:00 EUR Euro-Zone Producer Price Index (YoY) (NOV) 4.40% 4.40%
WED 13:30 USD ADP Employment Change (DEC) 100K 93K
WED 15:00 USD ISM Non-Manufacturing Composite (DEC) 55.60 55.00
THU 10:00 EUR Euro-Zone Retail Sales (YoY) (NOV) 2.10% 1.40%
THU 10:00 EUR Euro-Zone Economic Confidence (DEC) 105.50 105.30
THU 10:00 EUR Euro-Zone Consumer Confidence (DEC) -9.00 -9.40
THU 10:00 EUR Euro-Zone Industrial Confidence (DEC) 1.90 0.90
THU 10:00 EUR Euro-Zone Services Confidence (DEC) 10.10 10.20
THU 15:00 CAD Ivey Purchasing Managers Index (DEC) 54.00 57.50
FRI 07:00 EUR German Exports s.a. (MoM) (NOV) 0.90% -1.30%
FRI 07:00 EUR German Imports s.a. (MoM) (NOV) 2.00% 0.10%
FRI 10:00 EUR Euro-Zone Gross Domestic Product (QoQ) (3Q F) 0.40% 0.40%
FRI 10:00 EUR Euro-Zone Gross Domestic Product (YoY) (3Q F) 1.90% 1.90%
FRI 10:00 EUR Euro-Zone Unemployment Rate (NOV) 10.10% 10.10%
FRI 11:00 EUR German Industrial Production (YoY) (NOV) 10.90% 11.70%
FRI 11:00 EUR German Industrial Production s.a. (MoM) (NOV) -0.20% 2.90%
FRI 12:00 CAD Full Time Employment Change (DEC)
-11.50
FRI 12:00 CAD Participation Rate (DEC) 67.00 66.90
FRI 12:00 CAD Net Change in Employment (DEC) 20.0K 15.2K
FRI 12:00 CAD Part Time Employment Change (DEC)
26.70
FRI 12:00 CAD Unemployment Rate (DEC) 7.70% 7.60%
FRI 13:30 CAD Average Hourly Earning (MoM) (DEC) 0.20% 0.00%
FRI 13:30 CAD Average Weekly Hours All Employees (DEC) 34.30 34.30
FRI 13:30 USD Change in Non-farm Payrolls (DEC) 140K 39K
FRI 13:30 USD Unemployment Rate (DEC) 9.70% 9.80%
FRI 20:00 USD Consumer Credit (NOV) $0.3B $3.4B

As noted a few EU economies are set to release their PMI figures this week, and of course the much watched US ISM PMI stats are also out. The US is expected to show a slight improvement in the manufacturing index, ditto the services or non-manufacturing index. Meanwhile, China released its official PMI results in the last couple of days, showing a bit of a drop - but that's to be expected in some sense given the measures taken toward controlling inflation, as well as energy related targets; of course this will be the wild card for 2011... for the US though, 2011 could well be a much better year than 2010.

Back onto the EU, the statistics agency, Eurostat, will release the final reading of GDP data for Q3 this week, with little change expected - but with a few more details. Amongst the other stats set to be released by the EU are unemployment rate (expected to remain about 10%), a range of confidence indexes (which are broadly expected to improve slightly), and the December initial CPI estimate (expected to bump up slightly to a still subdued 2%).

Over to the US, as noted the key release will be the nonfarm payrolls data on Friday, consensus says a better month for December, so let's watch that one closely. The other interesting bits out of the US include Consumer Credit data for Nov (expect pretty flat results), the PMI indices as noted, and in monetary policy - the Fed releases the meeting minutes from the Dec 14 FOMC meeting... which may make for interesting reading, worth a skim at least.

So as always, have a great week, watch out for surprises, and stay tuned for updates...

Sources
DailyFX www.dailyfx.com/calendar
Forex Pros www.forexpros.com/economic-calendar/
Forex Factory www.forexfactory.com/calendar.php
Bloomberg www.bloomberg.com
+various statistics websites and central bank websites for verification


Article Source: http://www.econgrapher.com/2jan11-calendar.html

Friday, December 3, 2010

Top 5 Economics Graphs of the Week - 4 December 2010

This week we look at the US PMI results; while also reviewing the China PMI data for November. Then we check out the 3rd quarter GDP results for Australia, before wrapping up with a closer look at some US data on the housing market, consumer confidence, and the nonfarm payrolls report.

1. US PMI
The US manufacturing PMI came in at 56.6, a little below consensus 57 and previous 56.9, the non-manufacturing PMI matched consensus at 55.0, and increased vs October's 54.3 reading. So between manufacturing and services there was a bit of variation, also within the results the manufacturing sub-components were not great e.g. falls in new orders, production, employment, exports. But within the services sub-indices there was a bit more positives e.g. rises in new orders, new export orders, employment, etc. So overall the results are generally positive, and not really surprising given where the US economy is at.

2. China PMI
Over to China, the official PMI rose to 55.2 from 54.7 in October; beyond expectations for 54.8. The HSBC Markit index rose to an 8 month high of 55.3 from 54.8 in October. The standouts in the sub-indices were Production (58.5 vs 57.1), Supplier Delivery (48.9 vs 49.3), New Orders was basically flat, but still strong (58.3 vs 58.2), similarly Employees was little changed (52.0 vs 52.1). In general its good to see the index rising, its also positive to see it still in the expansionary zone, and it will give comfort to those watching China's attempt at a managed slowdown as inflation pressures rise.

3. Australia GDP
The Australian economy grew 0.20% q/q in the September quarter, placing Australian GDP up 2.7% year on year. The pace of growth was slower than the expected 0.40% q/q growth, as global volatility, exchange rate pressures on exports, and withdrawal of fiscal stimulus measures took their toll on the Australian economy. Looking forward though the pace of growth is likely to rebound in 2011 as the resources sector surges ahead with a number of large scale mining projects in the pipeline, and farming continues to contribute; and of course the flow on effects to the rest of the economy.

4. US House Prices and Confidence
Two key pieces of data release last week were the Case-Shiller house price index, which showed house prices falling further (no surprise). The other key data point was the Conference Board Consumer Confidence index, which showed a jump to 54.1 (vs consensus 52, previous 50.2). Within the confidence numbers, the present situation index rose to 24 from 23.5 and the expectations index jumped to 74.2 from 67.5 previously. So people are feeling a little better about the future, but just not so much about the here and now. And looking to the housing market, the future may be better, but the short-medium term probably has further downside risk unless the fundamentals sharply turnaround.

5. US Nonfarm Payrolls
The US added 39k nonfarm payrolls in November, vs 151k in October, and well below consensus 168k. Private payrolls were up 50k vs 159k in October. Average hourly earnings were flat, as was the average work week. So overall not a great result, good that it was positive, but basically it lines up with the idea that the US recovery is not going to be linear, and basically that there is going to be choppiness as the US economy muddles through the next year or two.

Summary

So we saw the manufacturing PMI in the US still strong, but with some negatives in the sub-components, the services PMI however was a bit stronger and relatively more promising. Meanwhile in China the manufacturing PMI improved, showing that the concern is rightfully more about the risks of overheating rather than not growing. In Australia, the economy continued to grow, but a little less so as stimulus wore off, but expect the slowdown to be temporary. Back to the US, the housing market is still under the gun, but the consumer is slowly feeling a bit better about the future, in spite of the job market also remaining relatively subdued.

Sources
1. Institute for Supply Management www.ism.ws & Yahoo Finance finance.yahoo.com
2. CFLP www.chinawuliu.com.cn & Markit/HSBC www.markiteconomics.com & National Bureau of Statistics www.stats.gov.cn
3. Australian Bureau of Statistics www.abs.gov.au
4. Conference Board www.conference-board.org & Standard & Poors www.standardandpoors.com
5. Bureau of Labour Statistics www.bls.gov


Article Source: http://www.econgrapher.com/top5graphs-4dec.html

Saturday, November 27, 2010

Economic Calendar - 28 November 2010

Here's the Economic Calendar for the week commencing the 28th of November 2010. This week December starts! So the PMI data will start flowing with releases expected from China, Japan, the US, and the EU, among others. There's also some more GDP data out this week with Australia, Canada, and Switzerland announcing their Q3 results. In the US there's the S&P/Case-Shiller house price index, consumer confidence, nonfarm payrolls, and the Beige Book from the Fed.

(More commentary follows the table)

Day GMT Country/
Currency
Event Forecast Previous
SUN 21:45 NZD Trade Balance [New Zealand dollars] [OCT] -400M -532M
SUN 21:45 NZD Exports [New Zealand dollars] [OCT] 3.31B 3.16B
SUN 21:45 NZD Imports [New Zealand dollars] [OCT] 3.78B 3.69B
SUN 23:50 JPY Retail Trade [YoY] [OCT] 0.70% 1.40%
SUN 02:00 NZD NBNZ Business Confidence [NOV]
23.70
MON 10:00 EUR Euro-Zone Business Climate Indicator [NOV] 1.05 0.98
MON 10:00 EUR Euro-Zone Consumer Confidence [NOV F] -10.00 -10.00
MON 10:00 EUR Euro-Zone Economic Confidence [NOV] 105.00 104.10
MON 10:00 EUR Euro-Zone Industrial Confidence [NOV] 2.00 0.00
MON 10:00 EUR Euro-Zone Services Confidence [NOV] 9.00 8.00
MON 13:30 CAD Current Account [BoP] [Canadian dollar] [3Q] -$15.2B -$11.0B
MON 23:30 JPY Jobless Rate [OCT] 5.00% 5.00%
MON 23:50 JPY Industrial Production [MoM] [OCT P] -3.20% -1.60%
MON 23:50 JPY Industrial Production [YoY] [OCT P] 3.10% 11.50%
MON 00:30 AUD Current Account Balance [Australian Dollar] [3Q] -6600M -5640M
TUE 05:00 JPY Housing Starts [YoY] [OCT] 9.70% 17.70%
TUE 05:00 JPY Annualized Housing Starts [OCT] 0.840M 0.837M
TUE 05:00 JPY Nomura/JMMA Manufacturing PMI [NOV]
47.20
TUE 08:55 EUR German Unemployment Change [NOV] -20K -3K
TUE 10:00 EUR Euro-Zone CPI Estimate [YoY] [NOV] 1.90% 1.90%
TUE 10:00 EUR Euro-Zone Unemployment Rate [OCT] 10.10% 10.10%
TUE 11:00 EUR Italian Unemployment Rate s.a. [OCT] 8.40% 8.30%
TUE 13:30 CAD Gross Domestic Product [MoM] [SEP] [SEP] 0.10% 0.30%
TUE 13:30 CAD Quarterly GDP Annualized [3Q] 1.50% 2.00%
TUE 14:00 USD S&P/Case-Shiller Composite-20 [YoY] [SEP] 1.00% 1.70%
TUE 14:00 USD S&P/Case-Shiller US Home Price Index [YoY]
3.60%
TUE 14:00 USD S&P/Case-Shiller 20 City [MoM] s.a. [SEP] -0.40% -0.28%
TUE 15:00 USD Consumer Confidence [NOV] 52.70 50.20
TUE 00:30 AUD Gross Domestic Product [QoQ] [3Q] 0.50% 1.20%
TUE 00:30 AUD Gross Domestic Product [YoY] [3Q] 3.40% 3.30%
TUE 01:00 CNY PMI Manufacturing [NOV] 54.80 54.70
TUE 02:00 NZD ANZ Commodity Price [NOV]
2.90%
TUE 02:30 CNY HSBC Manufacturing PMI [NOV] 55.40 54.80
WED 07:00 GBP Nationwide House Prices n.s.a. [YoY] [NOV]
1.40%
WED 07:00 GBP Nationwide House Prices s.a. [MoM] [NOV] -0.40% -0.70%
WED 08:45 EUR Italian PMI Manufacturing [NOV] 53.10 53.00
WED 08:50 EUR French PMI Manufacturing [NOV F] 57.50 57.50
WED 08:55 EUR German PMI Manufacturing [NOV F] 58.90 58.90
WED 09:00 EUR Euro-Zone PMI Manufacturing [NOV F] 55.50 55.50
WED 09:30 GBP Purchasing Manager Index Manufacturing [NOV] 54.70 54.90
WED 13:30 USD Non-Farm Productivity [3Q] F 2.30% 1.90%
WED 13:30 USD Unit Labor Costs [3Q F] [3Q] F -0.20% -0.10%
WED 15:00 USD ISM Manufacturing [NOV] 56.50 56.90
WED 15:00 USD Construction Spending [MoM] [OCT] -0.40% 0.50%
WED 19:00 USD Fed's Beige Book [DEC]

WED 00:30 AUD Trade Balance [Australian dollar] [OCT] 2000M 1760M
WED 00:30 AUD Retail Sales s.a. [MoM] [OCT] 0.40% 0.30%
THU 06:45 CHF Gross Domestic Product [YoY] [3Q] 3.10% 3.40%
THU 06:45 CHF Gross Domestic Product [QoQ] [3Q] 0.50% 0.90%
THU 08:15 CHF Retail Sales [Real] [YoY] [OCT]
4.10%
THU 09:30 GBP Purchasing Manager Index Construction [NOV] 51.30 51.60
THU 10:00 EUR Euro-Zone Gross Domestic Product [QoQ] [3Q] 0.40% 0.40%
THU 10:00 EUR Euro-Zone Gross Domestic Product [YoY] [3Q] 1.90% 1.90%
THU 10:00 EUR Euro-Zone Producer Price Index [MoM] [OCT] 0.30% 0.30%
THU 10:00 EUR Euro-Zone Producer Price Index [YoY] [OCT] 4.30% 4.20%
THU 12:45 EUR European Central Bank Rate Decision [DEC] 1.00% 1.00%
THU 15:00 USD Pending Home Sales [MoM] [OCT] -1.00% -1.80%
THU 15:00 USD Pending Home Sales [YoY] [OCT]
-24.90%
THU 01:00 CNY China Non-manufacturing PMI [NOV]
60.50
THU 02:30 CNY China HSBC Services PMI [NOV]
56.40
FRI 05:00 EUR German Retail Sales [MoM] [OCT] 1.20% -1.70%
FRI 05:00 EUR German Retail Sales [YoY] [OCT] 1.30% 0.40%
FRI 08:15 CHF Consumer Price Index [MoM] [NOV] 0.10% 0.50%
FRI 08:15 CHF Consumer Price Index [YoY] [NOV] 0.10% 0.20%
FRI 09:00 EUR Euro-Zone PMI Composite [NOV F] 55.40 55.40
FRI 09:00 EUR Euro-Zone PMI Services [NOV F] 55.20 55.20
FRI 10:00 EUR Euro-Zone Retail Sales [MoM] [OCT] 0.20% -0.20%
FRI 10:00 EUR Euro-Zone Retail Sales [YoY] [OCT] 1.00% 1.30%
FRI 12:00 CAD Net Change in Employment [NOV] 20.0K 3.0K
FRI 12:00 CAD Unemployment Rate [NOV] 7.90% 7.90%
FRI 13:30 USD Change in Private Payrolls [NOV] 153K 159K
FRI 13:30 USD Change in Non-farm Payrolls [NOV] 142K 151K
FRI 13:30 USD Unemployment Rate [NOV] 9.60% 9.60%
FRI 15:00 USD ISM Non-Manufacutring Composite [NOV] 54.70 54.30
FRI 15:00 USD Factory Orders [OCT] -1.00% 2.10%

As noted it will be a big week for PMI (Purchasing Manager's Index) data releases. As can be seen in the table, results are due from the US, China, Japan, and throughout the EU. The results will provide a timely update, especially for the China and US results. I will be watching these two in particular very closely and will put out updates throughout the week. Consensus forecasts are picking a bit of an increase in China, and flat in the US, watch this space.

Australia will announce its 3rd quarter GDP result on Tuesday, with consensus picking slightly slower quarterly growth, and stronger year on year growth. Canada will also provide an update on its GDP results as will Switzerland and the wider EU. The EU is not expected to make an large revisions to its Q3 GDP results, but it will be worth a look, particularly on a country-by-country basis.

On the monetary policy front the European Central Bank meets on Thursday, and as usual the rate likely wont be moving, but it will be interesting to see what the ECB says given the rumblings in the EU sovereigns markets. As noted, the US Fed also releases the Beige book economic report this week, which will be interesting in light of the Fed's recent launch of QEII. Elsewhere in the world, Pakistan reviews rates on Monday, Thailand on Wednesday, and Indonesia on Friday; expecting only changes from Pakistan.

Apart from PMI, GDP, and monetary policy, some of the other interest data points out this week include: Japan industrial production (expected to slow), EU CPI and unemployment rate (expect little change), S&P Case-Shiller house price index (expect a monthly decline in Sep), US consumer confidence (expect an improvement), and of course US employment data for November with nonfarm payrolls expected to expand by a similar amount as October, and no change to the unemployment rate.

So as always, have a great week, watch out for surprises, and stay tuned for updates...

Sources
DailyFX www.dailyfx.com/calendar
Forex Pros www.forexpros.com/economic-calendar/
Forex Factory www.forexfactory.com/calendar.php
Bloomberg www.bloomberg.com
+various statistics websites and central bank websites for verification


Article Source: http://www.econgrapher.com/28nov-calendar.html