Showing posts with label inflation. Show all posts

Saturday, July 23, 2011

Top 5 Graphs of the Week - 24 Jul 2011

This week we check in on the current inflation and monetary policy situation for the key developed economies and emerging markets, with a particular focus on the outlook for inflation and interest rates, and the likely consequent outlook for developed vs emerging market equities. Overall it's looking like the monetary policy outlook may become more friendly to emerging markets than developed markets, but of course that could all change if certain key risks materialize...

1. BRIC Inflation
Inflation has been a key issue in emerging markets this year, creating a unique set of risks e.g. policy tightening, overheating and hyperinflation, social unrest, exported inflation, etc. These risks have only expressed to a limited extent so far. Within the BRIC economies the most recent data (Brazil 6.71%, Russia 9.4%, India 8.72%, China 6.4%) has shown some hope of a peak in inflation or a tapering off, but the risk of further inflation remains as the BRIC economies remain relatively strong, and with commodity prices easing only somewhat. So the key focus for inflation risks is whether the recent string of monetary policy tightening moves is enough...
2. BRIC Interest Rates
Looking at the BRIC central banks, focusing on interest rates, total interest rate moves since policy rates bottomed out are as follows: Brazil +375 basis points, Russia +50bps, China +125bps, India +325bps. Each of the banks are playing a delicate and fraught balancing act with the risks of further inflation on the one hand and the risks of scuttling growth or even hard landing on the other hand. For now the balance is probably about right, but we're approaching territory where any further upside impetus on the inflation front is likely to force the central banks' hands to more aggressive tightening. Of course this will be bad for equities, with emerging market equities being held firmly back by this monetary policy tightening, but on the other hand, if inflation shows signs of peaking or even turning then emerging market equities should start to factor in an end to monetary policy tightening.

3. Developed Market Inflation
While developed markets have not been growing as fast as emerging markets, thanks in part to rising commodity prices, general price normalization, and demand normalization, inflation has clearly recovered in developed markets. Since their lowest figures in 2009 to the most recent readings inflation has increased as follows US +570bps, EU +340bps, Japan +290bps, UK +310bps. However each of those economies still remain at least 100bps away from the peak inflation figures of 2008. That will most likely not last. In fact, without a significant drop in commodity prices or a return to recession (a non-zero probability given some of the recent weaker readings and the Euro and US debt risks), inflation will almost certainly return to pre-crisis levels, and policy makers could easily miss the boat.


4. Developed Market Interest Rates
With the exception of the ECB, the monetary policy response to rising inflation has been to ignore it and focus on the growth side of things. This stance probably makes sense for the period of about 2-years after the crisis due to the depth and severity of it all. But abnormally low rates are not sustainable, low rates lead to greater risk appetites and ultimately higher inflation. The only saving grace is that governments like the US, UK and Japan all seriously need to do some decent fiscal tightening to get their government finances in order; this may (or may not) contain some aspects of inflation, but ultimately these banks need to start on a slow progression back to normality. So on balance the monetary policy outlook for developed markets is likely more bearish for equities than the outlook in emerging markets.

5. Monetary Policy Week in Review
Diving back down to the detail in the here and now, the past week in monetary policy saw the Banco Central do Brasil increase its Selic rate by 25 basis points to 12.50%. Meanwhile those that held rates unchanged were: Canada at 1.00%, South Africa at 5.50%, Turkey at 6.25%, and Egypt at 8.25%. Common themes in the media releases were a pretty keen focus on the risks coming from the EU and US debt situations, and Brazil possibly signaled an end to its tightening cycle. Next week there's a few interesting monetary policy decisions due; Israel, India, New Zealand and the Philippines are among those reviewing policy settings, with India the only one expected to move, with consensus seeing another +25bps.

Summary

So we saw inflation tracking along in emerging markets, showing a brief history of accelerating inflation, and although upside inflation risks remain, there are some signs that inflation may be peaking in at least some of the BRIC economies. Accordingly the monetary policy outlook for emerging markets could well become more accomodative, or at least no more tighter, and this could possibly brighten the outlook for emerging market equities.

Over to developed markets, flirtations with deflation were quite short-lived as the past year or so has seen significant reinflation, and unless fiscal tightening is particularly onerous, and as long as another slowdown is avoided, the inflation outlook for developed economies might be for further upside. Accordingly, the monetary policy outlook for developed economies is, or at least should be, for tightening and higher interest rates, which may take some of the shine of developed market equities.

So for the emerging market vs developed market equity allocation, a keen eye should be fixed on the developing inflation and monetary policy outlook, for today; this is a macro-driven market.

Graph Sources:
1. Trading Economics www.tradingeconomics.com
2. Central Bank News www.centralbanknews.info
3. OECD Statistics stats.oecd.org
4. Central Bank websites
5. Central Bank News www.centralbanknews.info

Saturday, July 16, 2011

Monetary Policy Week in Review (Guest Post)

The past week in monetary policy was dominated by Asian central banks, with the central banks of Japan, Indonesia, Thailand, and South Korea all announcing interest rate decisions. The only banks to adjust interest rates were Thailand +25bps to 3.25%, and Kenya, which dropped its discount window rate -175bps to 6.25%. Meanwhile those that held interest rates unchanged were: Japan 0.10%, Indonesia 6.75%, Latvia 3.50%, South Korea 3.25%, and Chile 5.25%. Elsewhere in monetary policy and central banking, Brazil's central bank announced further policy measures to curb speculation on its currency, the Real.

While inflation remained a threat for most of the central banks who reviewed monetary policy settings during the week, for many the focus was squarely on the downside risks to both domestic and global growth. Indeed a couple of the banks pointed specifically to the tail risks in the form of the European sovereign debt crisis. For those that held rates unchanged, for the most part the messaging was positive, with some viewing inflationary pressures as somewhat contained, while many presented a positive outlook on their domestic economy.

As per usual, following is a selection of key quotes from central bank monetary policy statements and media releases from the past week:

  • Bank of Japan (held interest rate at 0.10%): "Japan's economic activity is picking up with an easing of the supply-side constraints caused by the earthquake disaster. After declining sharply following the earthquake, production has recently shown clear signs of picking up with the easing of supply-side constraints."
  • Bank Indonesia (held interest rate at 6.75%): "Bank Indonesia views that the current BI Rate level is still in line with the effort to maintain stronger economic activities supported by stability, amid domestic excess liquidity and continued large capital inflows... Meanwhile, inflation is estimated to be under control and could be lower than earlier forecasted if there is no Government policies regarding energy prices while the supply and distribution of basic foods are well maintained."
  • Bank of Thailand (increased interest rate 25bps to 3.25%): "In light of the continued risks to inflation amid robust domestic demand, the MPC deemed it necessary to continue increasing the policy rate to maintain economic stability and anchor inflation expectations... Inflationary pressure remained high due to elevated energy prices and continued upward adjustments in the prices of prepared foods."
  • Bank of Korea (held interest rate at 3.25%): "The Committee expects the high level of inflation to continue in the coming months, driven largely by demand-side pressures resulting from the underlying uptrend in economic activity and by inflation expectations."
  • Banco Central de Chile (held interest rate at 5.25%): "Domestically, output, demand and labor market figures are progressing with strength, showing signs of moderation in line with the baseline scenario in the last Monetary Policy Report. Annual CPI inflation indicators have hovered around 3%, while measures of core inflation remain bounded. Private inflation expectations show a decline, although some of them remain above the target."

As for next week the Reserve Bank of Australia (19th of July), and the Bank of England (20th of July) will release the minutes from their most recent monetary policy meetings, meanwhile the following central banks are scheduled to review interest rates:

  • Canada (Bank of Canada) - expected to hold at 1.00% on the 19th of July
  • Brazil (Banco Central do Brasil) - expected to increase rate 25bps to 12.50% on the 20th of July
  • South Africa (South African Reserve Bank) - expected to hold at 5.50% on the 21st of July
  • Turkey (Central Bank of the Republic of Turkey) - expected to hold at 6.25% on the 21st of July

Source: www.CentralBankNews.info

Article source:
http://www.centralbanknews.info/2011/07/monetary-policy-week-in-review-16-july.html

Monday, May 9, 2011

Economic Calendar: China Data, U.S. Inflation, and EU GDP

Here's the Economic Calendar for the week commencing the 8th of May 2011. This week features China's monthly economic data release with PPI, CPI, industrial production, retail sales, fixed asset investment, and international trade stats due out from the world's second largest economy. Elsewhere there is an emphasis on inflation data with CPI due from Germany, France, Switzerland, and the US, there's also PPI data due from those countries. The other key data pieces will be eurozone GDP, and industrial production data from the eurozone, UK, Italy, France, and of course China.

http://seekingalpha.com/article/268736-economic-calendar-china-data-u-s-inflation-and-eu-gdp

Monday, April 25, 2011

Economic Calendar: U.S. and U.K. GDP, More Inflation Data, and the Fed

Here's the economic calendar for the week commencing the 24th of April 2011. The week ahead holds a range of key economic events including much anticipated Q1 GDP results for the U.S. and U.K. Monetary policy meetings in the U.S., Japan and New Zealand. House price data and consumer confidence numbers in the U.S. And inflation numbers from Australia, Japan, and much of the Euro-Zone economies.

http://seekingalpha.com/article/265145-economic-calendar-u-s-and-u-k-gdp-more-inflation-data-and-the-fed

Friday, April 22, 2011

Top 5 Economics Graphs of the Week - 23 Apr 2011

This week the focus goes to the giants of the emerging markets, the "BRIC" economies (the economic/investment one, not the political club). In this edition we review inflation, GDP, monetary policy and the stock markets of Brazil, Russia, India, and China. Also thrown in is a quick review of the monetary policy decisions over the past week.

1. BRIC Inflation
First up is a look at inflation, the BRIC economies are basically the key representatives of emerging markets. And if there's been one key theme for emerging markets, it's inflation. Inflation has been surging in the emerging market world over the past year, driven by a strong run-up in agricultural commodities, thanks to supply shocks paired with the steady increase in demand due to rising wealth in places like the BRIC economies. As I've noted before, inflation will be the key issue in emerging markets this year - mostly because of the monetary policy response, and the subsequent impact on GDP, and stock market returns. It is likely that we'll start to see a tapering off of inflation through the second half of this year - but if not, then things could get 'interesting'.

2. BRIC GDP
Over to GDP, the BRICs bounced back strongly from the great recession. China took a small hit, but charged back with large scale stimulus. India was more or less unscathed on its growth path. Brazil took a decent hit, but has subsequently returned to pre-crisis growth rates. Meanwhile Russia took a significant hit with the collapse of the commodity bubble and is still struggling to get back to pre-crisis levels as it takes on significant economic challenges. However, while the medium term outlook may be less than certain, the fundamentals still support the long term growth story. Also, while the pattern was similar to that of the developed markets' experience, on a relative basis emerging markets got off lightly.

3. BRIC Stock Indexes
Honing in on the stock markets of the BRIC economies, over the past 2 years Russian stocks have been the key performers (thanks in part to the rebound in commodity prices following the crash), while Indian stocks have been a distant second. Brazilian stocks have fallen slightly short of the S&P 500 and Chinese stocks remain weighed down due in part to the uncertainty around the monetary policy tightening cycle. The reigning intuition had been that since the BRIC economies are going to become the next big thing in terms of economic clout and contributors to global growth, then their stocks will also be the next big thing. But for a variety of reasons this may only be partially true. But interestingly, it also doesn't necessarily mean relative out-performance of US stocks since their are a lot of ADRs and large global companies that will reap rewards of said economic ascension, while benefiting from well developed capital markets and associated regulation and transparency.

4. BRIC Monetary Policy
On monetary policy, this (vis a vis inflation) is one of the key factors in the course of emerging market investments this year. The chart below shows that basically all of the BRIC economies are well into the monetary policy tightening cycle, with Brazil increasing rates again in the past week. Clearly, rising policy rates will have a negative short term impact on stocks since on the valuation front higher interest rates reduce the discounted cash flows due to a higher discount rate, but they also have the impact of slowing economic activity - even stalling it over the medium term. This explains much of the caution that investors have collectively shown in relation to emerging markets in recent times. And this is also why people should be watching developments there closely for signs that the worm may turn.

5. Monetary Policy
On the topic of monetary policy, the theme of global monetary policy tightening continued through the past week. The week saw interest rate increases from Thailand +25bps to 2.75%, Sweden +25bps to 1.75%, and Brazil +25bps to 12.00%. Of course there were also two reserve ratio hikes - showing that the inflation fight is not limited to the usual policy interest rate tools, with China hiking required reserves by 50bps and Turkey by 100bps. What was most interesting was the theme of a more global nature of policy tightening starting to come through. Sweden's move perhaps epitomized this, echoing the ECB's recent 25bp increase. So next week it will be particularly interesting to see what the US federal reserve has to say - indeed also Bernanke, in his post-meeting press conference.

Summary

So looking at the emerging giants that are the BRIC economies a couple of key themes stick out. First of all the long-term growth story remains intact, with no major damage to the fundamentals. However over the short-medium term the outlook is less than certain as the challenge of fighting rising inflation presents a tangible set of risks. The course of inflation, and thus monetary policy will perhaps be the key determinant of medium term investment returns. Interestingly, on the topic of monetary policy, the policy tightening cycle is well and alive, and is increasingly becoming a global theme. But there is some truth in the suggestion that emerging markets are a key driver behind this trend. So the main message - watch closely for a turn in the inflation worm.

Sources:
1. Trading Economics www.tradingeconomics.com
2. OECD Statistics stats.oecd.org
3. Yahoo Finance finance.yahoo.com
4. CentralBankNews.info www.centralbanknews.info
5. CentralBankNews.info www.centralbanknews.info

Article Source: http://www.econgrapher.com/top5graphs23apr11.html

Friday, April 8, 2011

Top 5 Economics Graphs of the Week - 9 Apr 2011

This week we focus in on the state of developed markets. First up is a look at the March PMI results for the US, then we look at some key economic data for the Group of 7 (G7). The graphs show rebounding inflation, very gradual improvement in employment figures, and normalizing GDP growth. Finally we check in on some of the monetary policy decisions over the past week, with an emphasis on the developed market vs emerging market monetary policy outlook.

1. US PMI results
The US recorded a flat reading on the manufacturing PMI with the index at 61.2 vs 61.4, meanwhile the non-manufacturing PMI slipped to 57.3 from 59.7. The standouts on the manufacturing side were many... new orders fell -4.7, production rose +2.7, prices rose +3.0, and backlog of orders and exports both fell -6.5. On the non-manufacturing side business activity dropped -7.2, backlogs were up +4.0, exports rose and imports fell and people thought they had a bit more inventory than they should. So overall the results for both indexes were mixed. The readings were still in positive territory but the direction of a few key sub-indexes give reason to be nervous. But then this recovery was never going to be linear.

2. G7 Inflation
Most of the G7 are yet to release their March inflation figures, but the February results were as follows: Canada 2.2% France 1.7% Germany 2.1% Italy 2.4% Japan 0% UK 4.4% US 2.1% bringing out a G7 average of 2%. The 2% G7 average compares to a low of -1.4% following the great recession and commodity price bubble and subsequent crash. But the interesting part is that the base-effect (i.e. rebound) is no longer the source of the 2+ readings, it's being driven mostly by rising commodity prices as well as a little bit of a boost from the economic recovery. But for the most part it is cost push inflation, and as the ECB noted, some of this is getting through into inflation expectations i.e. the 'second round effects'. Inflation is gradually becoming a developed market problem - not just emerging markets (and it remains to be seen whether a moderation of commodity prices would have a material impact).

3. G7 Unemployment
Unemployment rates on the other hand have been very slow to normalize, and this remains a challenge for some of the major economies. Within the G7 the February figures were: Canada 7.8% France 9.6% Germany 6.3% Italy 8.4% Japan 4.6% UK 8% (Jan) US 8.9% and the G7 average of 7.7%. Interestingly the big exporters Japan and Germany have done alright, while the rest are struggling with relatively more consumer oriented economies (and we all know how strong the consumer part of developed economies is at the moment!). So the employment situation is probably going to remain a challenge for these economies in the near term, it will be a slow recovery on the jobs front as part of the unemployment is structural - people will need to adjust, to find the new industries or even move - and this is why the spare capacity argument may not be as valid as usual because some 'spare capacity' may not actually be there any more.

4. G7 GDP Growth
Onto the hot topic of economic growth, with the EU just finalizing its Q4 figures this week the G7 results (real GDP growth on a year on year basis) were as follows: Canada 3.2% France 1.5% Germany 4% Italy 1.5% Japan 2.5% UK 1.5% US 2.8% and the G7 average at 2.6%. So all of the G7 economies have rebounded strongly from the deep trough of the great recession, but the trajectory looks like settling back to a lower pace for most, probably no double-dips (unless they really take their medicine on fiscal and private balance sheet repair - especially those with particularly unsustainable government debt and budget situations). But unless there is significant economic transformation (which usually takes some time and pain to implement) the growth rate will drop back a bit due to the structural nature and severity of the recession.

5. Monetary Policy Review
The two big stories of the week in this space were the People's Bank of China raising its 1-year lending rate by 25bps to 6.31% and the European Central Bank lifting the refinancing rate 25bps to 1.25%. The China move was probably most interesting from the perspective that it is likely nearing the end of its tightening cycle with inflation likely to peak in H1, and with the room to move on the RRR and rate being increasingly limited. Meanwhile the ECB's move may well herald the beginning of the tightening cycle for developed markets (or at least a wave of policy normalization). If this is right then the outlook for DM vs EM equities will have to reverse from DM being relatively attractive on most measures against EM, to vice versa. Indeed the flows situation has seen more funds going into US stocks and out of emerging market stocks over the past couple of quarters. These indeed are interesting times.

Summary

So we saw some mixed signals in the US PMI results, overall the readings were still at expansionary levels, and the nervousness around some of the details just reflects the non-linear nature of the recovery. Looking into some of the key economic metrics of the key developed markets of the G7 economies there were some interesting signs. Inflation looks to be broadly rising in developed markets, and potentially even becoming a problem not just of emerging markets. The labor market situation is unlikely to improve at a rapid pace given the structural nature of things, but there is signs of gradual improvement underway already. On the economic growth front the initial bounce back is almost certainly set to be followed by a period of below trend growth due to the structural nature of the recession and the severity of the crisis. But on monetary policy, going back to the inflation situation, it may be time for a passing of the tightening torch to developed markets. And these are some of the key issues to think (worry) about for global asset allocators!

Sources
1. Institute for Supply Management www.ism.ws & Yahoo Finance finance.yahoo.com
2. OECD Statistics Database stats.oecd.org
3. OECD Statistics Database stats.oecd.org
4. OECD Statistics Database stats.oecd.org
5. CentralBankNews.info www.centralbanknews.info


Article Source: http://www.econgrapher.com/top5graphs9apr11.html

Sunday, March 20, 2011

Rising Inflation Poses a Threat to Investment Yields

Leafing through reports from the IMF (International Monetary Fund) and BIS (Bank for International Settlements), I came across a few interesting charts and comments on inflation. Not to over do the inflation theme, it's worth highlighting some of the trends in inflation around the world because of the significant importance it has on how global economic prospects will evolve. Perhaps more importantly, the course of inflation will have significant financial market and investing implications.

http://seekingalpha.com/article/259106-rising-inflation-poses-a-threat-to-investment-yields

Friday, March 18, 2011

Top 5 Economics Graphs of the Week - 19 Mar 2011

This week the focus is on inflation as we review some of the latest inflation data from a selection of key economies. First we look at a revival in US inflation, then review the situation up in Canada, then we look at the inflation situation in the Euro Zone, before finishing up with a look at the BRIC economies. Following that is a review of some of the key monetary policy decisions over the past week.

1. US Inflation
The US recorded annual headline inflation of 2.2% in February, up from the 1.7% rate seen in January (up 0.5% month on month). Core inflation also continued its climb, rising to 1.1% from a low of 0.6% in October last year. The key driver of the rise in headline inflation was commodity prices, but specifically energy prices - with energy up 11% (no surprise given the recent run up in oil prices). The main takeaway from the result was a confirmation that the inflation situation in the US is starting to see greater inflationary pressures due to the transmission of rising commodity prices. The base case still seems to be one of higher or normalized inflation, but with a possibility of lower inflation or deflation if commodity prices drop back - but then you can't count out even higher inflation either - especially if the recovery really starts to gain traction and momentum.

2. Canada Inflation
To the north in Canada inflation came in at 2.2% for the 12-months to February (up 0.3% month on month), slightly lower than the 2.3% seen in January. The main driver of inflation in Canada has been energy costs, with gasoline prices up 15.7%, but the transportation component also tracked upwards, rising 5.1% from February, and alcohol and tobacco rising 2.7%. The core inflation figure in February was 0.9%. Thus the trends are relatively similar to that of the US, with commodity prices driving up inflation, but also a gradual rise in aggregate demand. The Bank of Canada has remained in pause mode after hiking rates three times last year, it is reasonably likely that the Bank may begin to recommence the monetary policy normalization process later this year.

3. EU Inflation
The EU recorded inflation of 2.4% in February, up from 2.3% in January, with the broader region recording 2.8% inflation, unchanged from January. EU core inflation came in at 1% after hovering around the 1-1.1% mark for the past few months. The lowest annual rates came from Ireland (0.9%), Sweden (1.2%), and France (1.8%), with the highest rates seen in Romania (7.6%), Estonia (5.5%), and Bulgaria (4.6%). The key contributors were housing (up 4.9%), transport (up 5.7%), and alcohol and tobacco (up 3.5%). As noted by the ECB when it put its tough stance on inflation forward in its latest meeting, inflation is tracking up in the Euro Zone, and it is primarily being driven by commodity prices - rather than by a significant improvement in aggregate demand. The ECB is concerned about second round effects on core inflation, and rightfully so.

4. BRIC Inflation
Looking abroad to the major emerging market economies, the BRIC (Brazil, Russia, India, China) economies have seen inflation rise to much higher levels than their developed market counterparts. Sure, on average the BRIC economies have a higher weighting to food prices in their indices (and rightfully so), so some of the high inflation is a result of last year's surge in agricultural commodity prices. But unlike the developed markets, the BRIC economies have broadly experienced pretty strong economic growth, so the aggregate demand side of the equation is having a significant effect on inflation too. This of course gives rise to policy risk for those markets, with India and China both announcing further monetary policy tightening moves last week.

5. Monetary Policy Review
The main events in monetary policy over the past week were: India increased rate +25bps to 6.75%, Chile increased +50bps to 4.00%, and Colombia increased +25bps to 3.50%, Japan expanded its asset purchase program another 5 trillion Yen in response to the unfolding natural and nuclear disasters, and China raised the required reserve ratio another 50 basis points - placing the rate at 20% for the larger banks. So for the most part it was the same old story of emerging market economies raising rates in response to higher inflation. But, some of the Banks like Norway and Switzerland made comments about the need to normalize policy in the near term... in other words more and more central banks are starting to talk about rising inflation, so this may well be the part where we start to see inflation as a global theme rather than an emerging market theme.

Summary

So we saw the US with rising headline and core inflation, showing that inflationary pressures are well entrenched for now. Up in Canada, inflationary pressures were likewise tracking along, likewise driven by the surge in commodity prices - but particularly energy prices. Over in the EU, the ECB's comments on inflation were confirmed by higher headline inflation, and it is right to worry about the second round effects of rising commodity prices. In the BRIC economies, the distinction is made that inflation is not just a supply side - commodities thing, it is also an aggregate demand thing. Thus we continued to see monetary policy tightening by emerging market central banks, but we also started to see greater vigilance on inflation from developed market central banks. So the question arises; has inflation now progressed from an emerging market theme to a global theme?

Sources
1. Bureau of Labour Statistics www.bls.gov
2. Trading Economics www.tradingeconomics.com
3. Eurostat epp.eurostat.ec.europa.eu
4. Trading Economics www.tradingeconomics.com
5. CentralBankNews.info www.centralbanknews.info

Article Source: http://www.econgrapher.com/top5graphs19mar11.html

U.S. Inflation Monitor, Part 2: A Broader View

In the second installment of this two-part article on U.S. inflation (see first part, on CPI and PPI, here), we look at a few other data points -- specifically, commodities, TIPS, and import and export prices. The point of this wider look is to gain a better gauge of where inflation is coming through and to garner any clues as to the traction inflation has. This is important for investors, as inflation has a critical impact on wealth, valuations, and prices. A keen awareness of the key inflation trends can help investors position themselves appropriately to both gain protection as well as profits.

http://seekingalpha.com/article/258968-u-s-inflation-monitor-part-2-a-broader-view?v=1300457214

U.S. Inflation Monitor: CPI and PPI

In this article we take a look at the key inflation metrics out of the U.S. over the past week. This article focuses on CPI and PPI, while a second installment looks at other data points to gain a fuller view of inflation in the U.S. In terms of the February results, both CPI and PPI were up (2.2% and 5.8%, respectively, on a year/year basis). Of course, both sets of statistics are on a headline basis.

http://seekingalpha.com/article/258940-u-s-inflation-monitor-cpi-and-ppi?v=1300450503

Saturday, March 5, 2011

Top 5 Economics Graphs of the Week - 6 Mar 2011

This week we look at the PMI results from the US and China, with some similar patterns and interesting conclusions. Then we review Australian GDP, finding some mixed signals, followed by a look at the recent US nonfarm payrolls report. Finally we wrap up with a review of some particularly interesting monetary policy decisions over the past week.

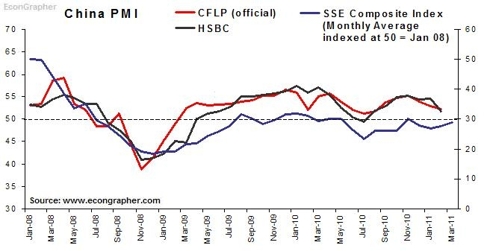
1. China PMI
China's February PMI readings showed a few seasonal quirks, but also pointed to rising inflationary pressures. The official CFLP PMI was 52.2 vs 52.9 prev, and the HSBC index was 51.7 vs 54.5. Though both indexes fell, they remained above 50 and generally did not point to any significant slowdown. The key warning signal that did come out of the numbers was for further upside inflation risks. The HSBC "Input Prices" sub-index came in at 74.6 vs 71 in January, as rising commodity prices put increasing upward pressure on prices in China and other emerging markets. The HSBC index also showed a rise in the backlogs of work, with rising capacity constraints showing through.

2. US PMI
The U.S. impressed once again with its manufacturing Purchasing Managers Index results. The main PMI index crept up a further 0.6 to 61.4, the highest level since the early 1980's. New orders added 0.2 to 68.0 and the employment sub-index added 2.8 to 64.5 as more employers signaled higher staff (a net 26% expect higher employment). On the non-manufacturing side, the NMI rose to 59.7 from 59.4, with the standouts being business activity +2.3, inventories +6.5, and most interestingly, new export orders +3 points to 56.5 (compared to the imports index at 53.4). Both indexes signalled rising cost pressures with the NMI prices sub-index up 1.2 to 73.3, and the PMI prices sub-index up 0.5 to 82 - showing that inflation is not dead.ff

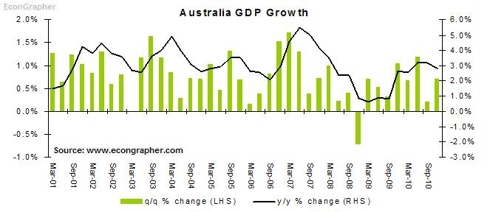
3. Australian GDP
The Australian economy produced a solid yet uninspiring GDP result for the final quarter of 2010. The Aussie economy expanded at a q/q growth rate of +0.7% (or 2.8% annualized), placing y/y growth at +2.7%. The majority of the growth came from inventory-building, with net exports neutral, and an insipid contribution from consumption. Thus the Australian economy appears to be passing through the hard part of its recession-free recovery. The outlook for the Australian economy is relatively strong growth - perhaps about 3%, and it's likely that any further tightening from the RBA will be pushed out well into the second half of this year.

4. US Nonfarm payrolls
The US recorded a bumper month, by recent standards, in February with 192k jobs added (compared to 36k in January). Private payrolls were up 222k, compared to 50k in Jan. The unemployment rate fell slightly to 8.9% - which is not that meaningful in the scheme of things. Average hourly earnings were flat, as was the average workweek. Thus overall it was a decent result in terms of the number of jobs added, sure some of it was January hiring being pushed into Feb, but a few more months like this would start to make a difference. As it stands, payrolls are still down a net -7.47 million since the start of 2008, so yeah, still a long way to go (oh and since January 2000, payrolls are net negative by about 30k, so who knows - next month could mark the start of a net positive number!).

5. Monetary Policy
In monetary policy the main standout for the week had to be the ECB's tough talking, and rhetoric that hinted at an impending rate hike - perhaps as soon as April. The other big one was Brazil tightening another 50bps, sending the Selic rate to 11.75% as it seeks to rein in rising inflation. Likewise Azerbaijan +200bps, Tajikistan +75bps, and the Dominican Republic +100bps also lifted rates to stave off rising inflation, driven by a spike in food and energy prices. So the usual theme of rising commodity prices and emerging market inflation was highlighted again - but the interesting part was the developed markets story. The European Central Bank specifically noted its concerns about the second round effects of rising commodity prices; so again, inflation is not dead...

Summary

So we saw China put out lower PMI figures, pointing to what will most likely be a temporary tapering off of activity, but more importantly; signaling rising inflationary pressures. Over to the US there was a much more positive PMI result, with some promising signs of strength in activity levels, but the costs pressures signals were also there. In Australia the economy is chugging along as per usual, though the 2010 Q4 results, though positive, were a little less inspiring. Back to the US, the February payrolls figure was a strong one, but there's still a lot more work to be done to get back even close to normal. Meanwhile in monetary policy, the ECB sent strong signals about and impending rate hike, and emerging markets, including one of the BRIC economies, continued to lift interest rates in response to their not-so-unique rising inflationary pressures situation.

Sources
1. CFLP www.chinawuliu.com.cn & Markit/HSBC www.markiteconomics.com & Yahoo Finance finance.yahoo.com
2. Institute for Supply Management www.ism.ws
3. Australian Bureau of Statistics www.abs.gov.au
4. Bureau of Labor Statistics www.bls.gov
5. CentralBankNews.info www.centralbanknews.info

Article Source: http://www.econgrapher.com/top5graphs6mar11.html

Friday, January 7, 2011

Top 5 Economics Graphs of the Week - 8 Jan 2011

This week we examine the US PMI results, US nonfarm payrolls, US equity and bond mutual fund flows trends, EU inflation and growth stats, and a review of monetary policy developments over the past week.

1. US PMI
The US had two good results, the manufacturing PMI increased to 57 from 56.6 (driven by strong new orders, production, and prices), and the non-manufacturing shot up to 57.1 from 55 (driven by new orders, business activity, and prices). The new orders part of the results was a cracker, with both sub-indices above 60), showing there may be a bit of momentum to come. Another interesting aspect of the releases was the increase in the price indexes: inflation? And the other notable was a small decline in both of the indexes' employment sub-indexes, which lines up with the good but not great NFP figure below.

2. US Nonfarm Payrolls
As noted, the figure came in a little lower than expected, and not really high enough to pull down the real unemployment rate. The figure was 103k jobs added, + upward revisions in Nov/Oct of about 70k. The unemployment rate went down to 9.4%, but not a good thing because it was participation rate driven (i.e. people who are becoming discouraged and pulling out of the labor force). So a good but not great result, this year should bring more job growth than last year as the recovery picks up (or as conditions normalize).

3. US Mutual Fund Flows
The story of 2010 mutual fund flows was a steady stream of net inflows into bond funds, with pretty lackluster flows for equity funds. But the worm may be turning, November saw the worst month in the year for bond fund flows, and a slight positive for equity funds. What's more, the weekly data through December (Dec monthly data not out yet) showed about -13 billion for bonds and about positive 5 billion for equity fund flows. So does this herald a trend of re-risking? Will we start to see the money go round reverse? ... Will equity flows beat bond flows this year? and of course what will this mean for the stock market?

4. EU Growth and Inflation
The EU finalized its GDP numbers for Q3, and released the first estimate of inflation for December, with both results being steady. It's likely both the GDP growth rate and inflation rate will muddle along at a subdued pace. But of course, the key risk for the EU is the "PIIGS", the Swiss National Bank has said it wont take Sovereign debt from Portugal or Ireland as collateral anymore, and well basically none of the problems have gone or even eased yet. So this remains a key risk for 2011. Oh and the ECB meets next week.

5. Monetary Policy Review
In monetary policy, Indonesia and Romania held, Peru raised rate 25bps, Bosnia reduced its RRR, and Chile announced currency intervention moves. But the real interesting development in monetary policy is the commodity story for 2011 - food prices remain high due to supply constraints (as well as some weather impacts), and energy is staging a cyclical rebound, pair that with fast growth in emerging markets and you have a real challenge for monetary policy setters in 2011. So, watch this space!

Summary

So we saw some pretty good PMI results in the US for December, which show that there is a bit of momentum in the US economy. The payrolls figure was good but not great; which may well be the theme for 2011. US mutual fund flows data pointed to a possible reversal of dominance from bond to equity funds for 2011. Over in the EU, conditions are on track but subdued, but of course there are still some relatively concerning risks bubbling away there. And on the monetary policy front, commodities and fast growing emerging markets are set to make this an "interesting" year for monetary policy makers.

Sources
1. US Institute for Supply Management www.ism.ws & Yahoo Finance finance.yahoo.com
2. US Bureau of Labor Statistics www.bls.gov
3. US Investment Company Institute www.ici.org
4. Trading Economics www.tradingeconomics.com
5. CentralBankNews.info www.centralbanknews.info


Article Source: http://www.econgrapher.com/top5graphs8jan11.html

Saturday, November 13, 2010

Economic Calendar - Week Starting 14 November 2010

Here's the Economic Calendar for the week commencing the 14th of November 2010. This week there's Japan Q3 GDP, with consensus picking a small acceleration from Q2. There's also meeting minutes due out from the BoE and RBA, which will be interesting in light of their recent decisions. Of course there's also a line up of inflation stats from the US, UK, and EU, as well as industrial production and retail sales stats.

(More commentary follows the table)

Day GMT Country/ Currency Event Forecast Previous
SUN 21:45 NZD Retail Sales (MoM) (SEP) 1.10% 0.00%
SUN 23:50 JPY Gross Domestic Product Annualized (3Q P) 2.50% 1.50%
SUN 23:50 JPY Gross Domestic Product (QoQ) (3Q P) 0.60% 0.40%
SUN 23:50 JPY Gross Domestic Product Deflator (YoY) (3Q P) -1.50% -1.70%
SUN 04:30 JPY Industrial Production (MoM) (SEP F)
-1.90%
SUN 04:30 JPY Industrial Production (YoY) (SEP F)

MON 10:00 EUR Euro-Zone Trade Balance s.a. (euros) (SEP) 1.0B -1.4B
MON 10:00 EUR Euro-Zone Trade Balance (euros) (SEP) 0.1B -4.3B
MON 13:30 USD Advance Retail Sales (OCT) 0.70% 0.60%
MON 13:30 USD Retail Sales Less Autos (OCT) 0.40% 0.40%
MON 13:30 USD Retail Sales Excluding Auto & Gas (OCT) 0.30% 0.40%
MON
CNY Actual FDI (YoY) (OCT) 10.40% 6.10%
MON 00:30 AUD Reserve Bank's Board November Minutes (NOV 15)

MON 02:00 CNY China September Leading Economic Index

TUE 09:30 GBP Consumer Price Index (MoM) (OCT) 0.20% 0.00%
TUE 09:30 GBP Consumer Price Index (YoY) (OCT) 3.10% 3.10%
TUE 09:30 GBP Core Consumer Price Index (YoY) (OCT) 2.60% 2.70%
TUE 09:30 GBP Retail Price Index (YoY) (OCT) 4.60% 4.60%
TUE 10:00 EUR Euro-Zone Consumer Price Index (YoY) (OCT F) 1.90%
TUE 10:00 EUR Euro-Zone Consumer Price Index (MoM) (OCT) 0.30% 0.20%
TUE 13:30 USD Producer Price Index (MoM) (OCT) 0.80% 0.40%
TUE 13:30 USD Producer Price Index Ex Food & Energy (YoY) (OCT) 2.10% 1.60%
TUE 14:15 USD Industrial Production (OCT) 0.30% -0.20%
TUE 14:15 USD Capacity Utilization (OCT) 74.90% 74.70%
TUE 01:30 USD Housing Starts (OCT) -1.60% 0.30%
WED 09:30 GBP Bank of England Minutes (NOV)

WED 09:30 GBP Jobless Claims Change (OCT) 6.0K 5.3K
WED 13:30 USD Consumer Price Index (YoY) (OCT)
1.10%
WED 13:30 USD Consumer Price Index (MoM) (OCT) 0.30% 0.10%
WED 13:30 USD Consumer Price Index Ex Food & Energy (MoM) 0.10% 0.00%
WED 13:30 USD Consumer Price Index Ex Food & Energy (YoY) 0.70% 0.80%
WED 13:30 USD Housing Starts (OCT) MOM% 600K 610K
WED 13:30 USD Building Permits (OCT) 570K 539K
WED 21:45 NZD Producer Prices- Inputs (QoQ) (3Q) 0.30%
WED 21:45 NZD Producer Prices- Outputs (QoQ) (3Q) 0.60%
THU 09:30 GBP Retail Sales (YoY) (OCT) 1.50% 1.80%
THU 09:30 GBP Retail Sales with Auto Fuel (YoY) (OCT) 0.00% 0.50%
THU 10:00 EUR Euro-Zone Current Account n.s.a. (euros) (SEP)
-10.5B
THU 10:00 EUR Euro-Zone Current Account s.a. (euros) (SEP)
-7.5B
THU 23:50 JPY Bank of Japan Meeting of the Minutes (OCT)

FRI 10:15 USD Bernanke Speaks at ECB Conference in Frankfurt

As mentioned, Japan is set to announce its September quarter GDP stats, with the market picking a positive number (after Q2 saw a negative nominal number - made positive only after factoring in deflation!). Consensus sees Q3 GDP rising 0.60% from Q2, vs 0.40% in Q2 from Q1. But overall it will be a good opportunity to check in on the worlds 3rd largest economy.

Sticking with Japan, the Bank of Japan joins the Reserve Bank of Australia, and Bank of England, in releasing its monetary policy meeting minutes. All three will be relatively interesting; Japan's last meeting was held just after the Fed announced QEII, the RBA surprised the market with its rate hike after communicating a different message, and the BoE held fire on any adjustments to its asset purchase program - so we will watch these with great interest.

On a similar topic, a key feature of this week will be the inflation data releases. There's the UK with its October CPI and RPI, the EU with October CPI, ditto the US; and the US also has PPI and capacity utilisation stats out. So it will be a great chance to see if these developed nations are seeing any trends like the Chinese with their rapidly accelerating inflation.

Other key data releases this week include industrial production stats from Japan and the US. Foreign direct investment and the leading economic index from China. And US housing starts for the October month. There's also the banking conference on Friday which will be hosted by the ECB.

So as always, have a great week, watch out for surprises, and stay tuned for updates...

Sources
DailyFX www.dailyfx.com/calendar
Forex Pros www.forexpros.com/economic-calendar/
Forex Factory www.forexfactory.com/calendar.php
Bloomberg www.bloomberg.com
+various statistics websites and central bank websites for verification


Article Source: http://www.econgrapher.com/14nov-calendar.html