Showing posts with label EU CPI. Show all posts

Saturday, May 21, 2011

Top 5 Economics Graphs of the Week - 22 May 2011

This week we take a look at some inflation numbers from the EU and UK, and while on the topic have a check in on commodity prices. Then we review the latest GDP numbers from Japan, before finishing up with a check in on global monetary policy.

1. EU Inflation
The EU saw a continued spike in inflation, with Euro Area annual inflation at 2.8%, vs 2.7% in March (1.5% in April 2010), while EU annual inflation rose to 3.2% vs 3.1% in March (2.0% in April 2010). Meanwhile Euro Area Core inflation was perhaps the most remarkable, rising to 1.6% in April, from 1.3% in March, and just 0.8% in April 2010. The highest rate of inflation was seen in Romania (8.4%), followed by Estonia (5.4%); while the lowest rate of inflation was recorded in Switzerland at just 0.1%, followed by Norway with 1.3%. While there is a degree of divergence in results, inflation is broadly creeping upwards in the Euro Zone and Core inflation is fast approaching the ECB inflation target.

2. UK Inflation
Over in the UK, a similar theme of rising inflation was seen with April annual consumer price inflation of 4.5%, up from 4.0% in March, and 4.0% in April 2010. The spike in inflation in the UK has caused some to speculate on a sharp rise in interest rates from the Bank of England, with inflation still well above its official inflation target. However the Bank of England, by and large, is not particularly set on aggressive tightening, particularly when the UK economy is still struggling along in recovery mode. The most likely policy path will be a steady path of rate increases, perhaps commencing later this year, depending on how the broader economy fares.

3. Commodities
On a rolling 12 month return basis, the latest data shows commodities were up 35.6% as measured by the Reuters/Jefferies commodity index. On a rolling monthly basis though the figure was -6.6% driven by a sell-off in a few commodities, particularly Silver. Commodity prices continue to be the key variable for 2011, as rising prices have catalyzed uprisings and social unrest, driven surging inflation in emerging markets, and have begun to have an increasing impact on inflation in developed markets. There's also the growth risks that high commodity prices present. But commodities are probably a good example of mean reversion in practice as high prices generally lead to a supply response, thus prices shouldn't be able to run up too high for too long unless structural changes have taken place in the global economy.

4. Japan GDP
Japan had a disappointing Q1 GDP figure, with GDP declining -0.9% on a quarterly basis (annualised -3.7%) , compared to -0.8% in Q4 2010, while Q1 2010 was 2.2%. On an annual basis this mean contraction of -0.7%, compared to 2.4% in Q4 2010, and 5.5% in Q1 2010. Much of the negative results can be explained by the impact of the earthquake as the disaster weighed heavily on private consumption and caused supply chain disruption impacting on net exports, and general uncertainty limiting capital spending. As with most large scale disasters the economic pattern is a short-term hit, but a medium term spike. So, provided the Japanese government can manage the process well, the rebuilding phase should help Japan's economy return to growth later this year, with 2012 likely to see much stronger economic activity levels.

5. Monetary Policy
The past week in monetary policy was relatively quiet with only 5 central banks announcing monetary policy decisions, and of those, only 1 adjusting its policy stance. Vietnam was the only bank to adjust monetary policy settings; increasing its reverse repurchase rate by 100 basis points to 15.00%. Meanwhile those that held their monetary policy interest rates unchanged were: Serbia (12.50%), Hungary (6.00%), Sri Lanka (7.00%), and Japan (0.10%). So there was somewhat of a theme of emerging markets beginning to ease off on aggressive policy tightening (with the exception of Vietnam, which is still seeing rampant inflation) as some inflation pressures begin to ease, if not peak, and as the growth outlook comes to fore in terms of policy risk. Monetary policy, and by extension inflation, remains one of the key factors for the growth and financial market outlook in emerging markets this year.

Summary

So we saw the pace of inflation beginning to show a more marked uptrend in the Euro Zone, which may well mean that the ECB's interest rate increase in April will likely be repeated in the near term. Meanwhile the UK also saw a continued high rate of inflation, but the Bank of England is still unlikely to budge as the UK economy is still on the go-slow. On a related topic, commodity prices saw surging 12-month returns in May, but with monthly returns diving into negative territory, perhaps heralding an easing in commodity prices over the medium term. In Japan, first quarter GDP results were disappointing, driven into negative territory by the disaster impact. On monetary policy, further signs of a peak in monetary policy tightening for emerging markets surfaced as the growth-inflation risk mix is becoming increasingly finely balanced.

Sources
1. EuroStat epp.eurostat.ec.europa.eu
2. National Statistics Office www.statistics.gov.uk
3. Jefferies www.jefferies.com
4. OECD Statistics stats.oecd.org
5. Central Bank News www.centralbanknews.info

Article Source: http://www.econgrapher.com/top5graphs22may11.html

Friday, March 18, 2011

Top 5 Economics Graphs of the Week - 19 Mar 2011

This week the focus is on inflation as we review some of the latest inflation data from a selection of key economies. First we look at a revival in US inflation, then review the situation up in Canada, then we look at the inflation situation in the Euro Zone, before finishing up with a look at the BRIC economies. Following that is a review of some of the key monetary policy decisions over the past week.

1. US Inflation
The US recorded annual headline inflation of 2.2% in February, up from the 1.7% rate seen in January (up 0.5% month on month). Core inflation also continued its climb, rising to 1.1% from a low of 0.6% in October last year. The key driver of the rise in headline inflation was commodity prices, but specifically energy prices - with energy up 11% (no surprise given the recent run up in oil prices). The main takeaway from the result was a confirmation that the inflation situation in the US is starting to see greater inflationary pressures due to the transmission of rising commodity prices. The base case still seems to be one of higher or normalized inflation, but with a possibility of lower inflation or deflation if commodity prices drop back - but then you can't count out even higher inflation either - especially if the recovery really starts to gain traction and momentum.

2. Canada Inflation
To the north in Canada inflation came in at 2.2% for the 12-months to February (up 0.3% month on month), slightly lower than the 2.3% seen in January. The main driver of inflation in Canada has been energy costs, with gasoline prices up 15.7%, but the transportation component also tracked upwards, rising 5.1% from February, and alcohol and tobacco rising 2.7%. The core inflation figure in February was 0.9%. Thus the trends are relatively similar to that of the US, with commodity prices driving up inflation, but also a gradual rise in aggregate demand. The Bank of Canada has remained in pause mode after hiking rates three times last year, it is reasonably likely that the Bank may begin to recommence the monetary policy normalization process later this year.

3. EU Inflation
The EU recorded inflation of 2.4% in February, up from 2.3% in January, with the broader region recording 2.8% inflation, unchanged from January. EU core inflation came in at 1% after hovering around the 1-1.1% mark for the past few months. The lowest annual rates came from Ireland (0.9%), Sweden (1.2%), and France (1.8%), with the highest rates seen in Romania (7.6%), Estonia (5.5%), and Bulgaria (4.6%). The key contributors were housing (up 4.9%), transport (up 5.7%), and alcohol and tobacco (up 3.5%). As noted by the ECB when it put its tough stance on inflation forward in its latest meeting, inflation is tracking up in the Euro Zone, and it is primarily being driven by commodity prices - rather than by a significant improvement in aggregate demand. The ECB is concerned about second round effects on core inflation, and rightfully so.

4. BRIC Inflation
Looking abroad to the major emerging market economies, the BRIC (Brazil, Russia, India, China) economies have seen inflation rise to much higher levels than their developed market counterparts. Sure, on average the BRIC economies have a higher weighting to food prices in their indices (and rightfully so), so some of the high inflation is a result of last year's surge in agricultural commodity prices. But unlike the developed markets, the BRIC economies have broadly experienced pretty strong economic growth, so the aggregate demand side of the equation is having a significant effect on inflation too. This of course gives rise to policy risk for those markets, with India and China both announcing further monetary policy tightening moves last week.

5. Monetary Policy Review
The main events in monetary policy over the past week were: India increased rate +25bps to 6.75%, Chile increased +50bps to 4.00%, and Colombia increased +25bps to 3.50%, Japan expanded its asset purchase program another 5 trillion Yen in response to the unfolding natural and nuclear disasters, and China raised the required reserve ratio another 50 basis points - placing the rate at 20% for the larger banks. So for the most part it was the same old story of emerging market economies raising rates in response to higher inflation. But, some of the Banks like Norway and Switzerland made comments about the need to normalize policy in the near term... in other words more and more central banks are starting to talk about rising inflation, so this may well be the part where we start to see inflation as a global theme rather than an emerging market theme.

Summary

So we saw the US with rising headline and core inflation, showing that inflationary pressures are well entrenched for now. Up in Canada, inflationary pressures were likewise tracking along, likewise driven by the surge in commodity prices - but particularly energy prices. Over in the EU, the ECB's comments on inflation were confirmed by higher headline inflation, and it is right to worry about the second round effects of rising commodity prices. In the BRIC economies, the distinction is made that inflation is not just a supply side - commodities thing, it is also an aggregate demand thing. Thus we continued to see monetary policy tightening by emerging market central banks, but we also started to see greater vigilance on inflation from developed market central banks. So the question arises; has inflation now progressed from an emerging market theme to a global theme?

Sources
1. Bureau of Labour Statistics www.bls.gov
2. Trading Economics www.tradingeconomics.com
3. Eurostat epp.eurostat.ec.europa.eu
4. Trading Economics www.tradingeconomics.com
5. CentralBankNews.info www.centralbanknews.info

Article Source: http://www.econgrapher.com/top5graphs19mar11.html

Friday, January 7, 2011

Top 5 Economics Graphs of the Week - 8 Jan 2011

This week we examine the US PMI results, US nonfarm payrolls, US equity and bond mutual fund flows trends, EU inflation and growth stats, and a review of monetary policy developments over the past week.

1. US PMI
The US had two good results, the manufacturing PMI increased to 57 from 56.6 (driven by strong new orders, production, and prices), and the non-manufacturing shot up to 57.1 from 55 (driven by new orders, business activity, and prices). The new orders part of the results was a cracker, with both sub-indices above 60), showing there may be a bit of momentum to come. Another interesting aspect of the releases was the increase in the price indexes: inflation? And the other notable was a small decline in both of the indexes' employment sub-indexes, which lines up with the good but not great NFP figure below.

2. US Nonfarm Payrolls
As noted, the figure came in a little lower than expected, and not really high enough to pull down the real unemployment rate. The figure was 103k jobs added, + upward revisions in Nov/Oct of about 70k. The unemployment rate went down to 9.4%, but not a good thing because it was participation rate driven (i.e. people who are becoming discouraged and pulling out of the labor force). So a good but not great result, this year should bring more job growth than last year as the recovery picks up (or as conditions normalize).

3. US Mutual Fund Flows
The story of 2010 mutual fund flows was a steady stream of net inflows into bond funds, with pretty lackluster flows for equity funds. But the worm may be turning, November saw the worst month in the year for bond fund flows, and a slight positive for equity funds. What's more, the weekly data through December (Dec monthly data not out yet) showed about -13 billion for bonds and about positive 5 billion for equity fund flows. So does this herald a trend of re-risking? Will we start to see the money go round reverse? ... Will equity flows beat bond flows this year? and of course what will this mean for the stock market?

4. EU Growth and Inflation
The EU finalized its GDP numbers for Q3, and released the first estimate of inflation for December, with both results being steady. It's likely both the GDP growth rate and inflation rate will muddle along at a subdued pace. But of course, the key risk for the EU is the "PIIGS", the Swiss National Bank has said it wont take Sovereign debt from Portugal or Ireland as collateral anymore, and well basically none of the problems have gone or even eased yet. So this remains a key risk for 2011. Oh and the ECB meets next week.

5. Monetary Policy Review
In monetary policy, Indonesia and Romania held, Peru raised rate 25bps, Bosnia reduced its RRR, and Chile announced currency intervention moves. But the real interesting development in monetary policy is the commodity story for 2011 - food prices remain high due to supply constraints (as well as some weather impacts), and energy is staging a cyclical rebound, pair that with fast growth in emerging markets and you have a real challenge for monetary policy setters in 2011. So, watch this space!

Summary

So we saw some pretty good PMI results in the US for December, which show that there is a bit of momentum in the US economy. The payrolls figure was good but not great; which may well be the theme for 2011. US mutual fund flows data pointed to a possible reversal of dominance from bond to equity funds for 2011. Over in the EU, conditions are on track but subdued, but of course there are still some relatively concerning risks bubbling away there. And on the monetary policy front, commodities and fast growing emerging markets are set to make this an "interesting" year for monetary policy makers.

Sources
1. US Institute for Supply Management www.ism.ws & Yahoo Finance finance.yahoo.com
2. US Bureau of Labor Statistics www.bls.gov
3. US Investment Company Institute www.ici.org
4. Trading Economics www.tradingeconomics.com
5. CentralBankNews.info www.centralbanknews.info


Article Source: http://www.econgrapher.com/top5graphs8jan11.html

Sunday, January 2, 2011

Economic Calendar - 2 January 2011

Here's the Economic Calendar for the week commencing the 2nd of January 2011. Welcome to 2011, may it be a year of health, success and prosperity for you! And what better way to start the first week of 2011 than a look at some of the upcoming economic events! This week there's December PMI figures out from the US, and most EU economies, there's also initial estimates on EU CPI - as well as the final estimate of Q3 GDP. And of course one of the main events will be the US nonfarm payrolls report on Friday (with similar data due from Canada).

(More commentary follows the table)

Date GMT Country/
Currency
Event Forecast Previous
MON 08:45 EUR Italian PMI Manufacturing (DEC) 52.20 52.00
MON 08:50 EUR French PMI Manufacturing (DEC F) 56.30 56.30
MON 08:55 EUR German PMI Manufacturing (DEC F) 60.90 60.90
MON 09:00 EUR Euro-Zone PMI Manufacturing (DEC F) 56.80 56.80
MON 15:00 USD ISM Manufacturing (DEC) 57.00 56.60
MON 15:00 USD ISM Prices Paid (DEC) 71.30 69.50
TUE 09:30 GBP Purchasing Manager Index Manufacturing (DEC) 57.40 58.00
TUE 10:00 EUR Euro-Zone CPI Estimate (YoY) (DEC) 2.00% 1.90%
TUE 15:00 USD Factory Orders (NOV) -0.20% -0.90%
TUE 19:00 USD Fed Releases Minutes - Dec 14 FOMC Meeting

TUE 22:00 USD ABC Consumer Confidence (JAN 2)

WED 10:00 EUR Euro-Zone Industrial New Orders (YoY) (OCT) 18.80% 13.40%
WED 10:00 EUR Euro-Zone Industrial New Orders (MoM) (OCT) 1.50% -3.80%
WED 10:00 EUR Euro-Zone Producer Price Index (MoM) (NOV) 0.30% 0.40%
WED 10:00 EUR Euro-Zone Producer Price Index (YoY) (NOV) 4.40% 4.40%
WED 13:30 USD ADP Employment Change (DEC) 100K 93K
WED 15:00 USD ISM Non-Manufacturing Composite (DEC) 55.60 55.00
THU 10:00 EUR Euro-Zone Retail Sales (YoY) (NOV) 2.10% 1.40%
THU 10:00 EUR Euro-Zone Economic Confidence (DEC) 105.50 105.30
THU 10:00 EUR Euro-Zone Consumer Confidence (DEC) -9.00 -9.40
THU 10:00 EUR Euro-Zone Industrial Confidence (DEC) 1.90 0.90
THU 10:00 EUR Euro-Zone Services Confidence (DEC) 10.10 10.20
THU 15:00 CAD Ivey Purchasing Managers Index (DEC) 54.00 57.50
FRI 07:00 EUR German Exports s.a. (MoM) (NOV) 0.90% -1.30%
FRI 07:00 EUR German Imports s.a. (MoM) (NOV) 2.00% 0.10%
FRI 10:00 EUR Euro-Zone Gross Domestic Product (QoQ) (3Q F) 0.40% 0.40%
FRI 10:00 EUR Euro-Zone Gross Domestic Product (YoY) (3Q F) 1.90% 1.90%
FRI 10:00 EUR Euro-Zone Unemployment Rate (NOV) 10.10% 10.10%
FRI 11:00 EUR German Industrial Production (YoY) (NOV) 10.90% 11.70%
FRI 11:00 EUR German Industrial Production s.a. (MoM) (NOV) -0.20% 2.90%
FRI 12:00 CAD Full Time Employment Change (DEC)
-11.50
FRI 12:00 CAD Participation Rate (DEC) 67.00 66.90
FRI 12:00 CAD Net Change in Employment (DEC) 20.0K 15.2K
FRI 12:00 CAD Part Time Employment Change (DEC)
26.70
FRI 12:00 CAD Unemployment Rate (DEC) 7.70% 7.60%
FRI 13:30 CAD Average Hourly Earning (MoM) (DEC) 0.20% 0.00%
FRI 13:30 CAD Average Weekly Hours All Employees (DEC) 34.30 34.30
FRI 13:30 USD Change in Non-farm Payrolls (DEC) 140K 39K
FRI 13:30 USD Unemployment Rate (DEC) 9.70% 9.80%
FRI 20:00 USD Consumer Credit (NOV) $0.3B $3.4B

As noted a few EU economies are set to release their PMI figures this week, and of course the much watched US ISM PMI stats are also out. The US is expected to show a slight improvement in the manufacturing index, ditto the services or non-manufacturing index. Meanwhile, China released its official PMI results in the last couple of days, showing a bit of a drop - but that's to be expected in some sense given the measures taken toward controlling inflation, as well as energy related targets; of course this will be the wild card for 2011... for the US though, 2011 could well be a much better year than 2010.

Back onto the EU, the statistics agency, Eurostat, will release the final reading of GDP data for Q3 this week, with little change expected - but with a few more details. Amongst the other stats set to be released by the EU are unemployment rate (expected to remain about 10%), a range of confidence indexes (which are broadly expected to improve slightly), and the December initial CPI estimate (expected to bump up slightly to a still subdued 2%).

Over to the US, as noted the key release will be the nonfarm payrolls data on Friday, consensus says a better month for December, so let's watch that one closely. The other interesting bits out of the US include Consumer Credit data for Nov (expect pretty flat results), the PMI indices as noted, and in monetary policy - the Fed releases the meeting minutes from the Dec 14 FOMC meeting... which may make for interesting reading, worth a skim at least.

So as always, have a great week, watch out for surprises, and stay tuned for updates...

Sources
DailyFX www.dailyfx.com/calendar
Forex Pros www.forexpros.com/economic-calendar/
Forex Factory www.forexfactory.com/calendar.php
Bloomberg www.bloomberg.com
+various statistics websites and central bank websites for verification


Article Source: http://www.econgrapher.com/2jan11-calendar.html

Friday, December 17, 2010

Top 5 Economics Graphs of the Week - 18 December 2010

This week we review inflation data from the US and the EU. Also examined is Japan's influential Tankan business sentiment survey, and a check in on US housing starts. Finally we sum up with a look at some of the many monetary policy decisions from the past week.

1. US Inflation
The US recorded a 1.1% y/y headline rate of inflation in November (vs 1.2% in October), and core inflation of 0.7% (vs 0.6% in October). So overall a pretty ho-hum result, inflation at the consumer level is still quite subdued despite inflation pressure beginning to rise at the producer level; particularly in commodities. So the case remains that the Fed still has its work cut out in terms of spurring up inflation - but the question is, when will the new worry of inflation rather than deflation come about? this is one to watch carefully.

2. EU Inflation
Over in the EU, inflation rates were unchanged between October and November, with the EU rate at 2.3%, and the Euro-Area headline rate at 1.9% and the Euro-Area core rate was 1.1%. The same old story of significant diversity across the region applied with the highest rate of 7.7% recorded in Romania, and the lowest rate -0.8% in Ireland. And so the Euro experiment continues, inflation will likely gradually pick up over the next year, provided that the economic recovery doesn't get derailed (and there are a few risks floating around).

3. Japan Tankan
The influential business sentiment survey, the Tankan all companies index had fell to -11 from -10. Large manufacturers declined to 5 from 8, and large non-manufacturers fell to 1 from 2. Small manufacturers improved to -12 from -14 and small non-manufacturers fell to -22 from -21. Thus overall the results were relatively negative, reflecting the challenging economic conditions in Japan. Companies are finding the dual effects of fading stimulus and a stronger Yen to be having a negative impact.

4. US Housing Starts
Housing starts in the US were basically flat again, recording 0.555m vs consensus 0.550m, and previous 0.519. So the results look kinda good, but in a time series (as in the chart below) it's clear the market is still just muddling along. The only real good news out of this piece is that at least it didn't get worse, i.e. there appears to be some stabilizing.

5. Monetary Policy Review
In the past week the central banks of Sri Lanka, US, Hong Kong, Norway, Namibia, Sweden, Botswana, Egypt, Switzerland, India, Poland, Turkey, Chile, Columbia all met to review monetary policy settings. There were a few movements in interest rates with those to tighten being: Sweden +25bps and Chile +25bps, while those that dropped rates were: Namibia -75bps, Botswana -50bps, and Turkey -50bps. While the rest held steady, and the US made no alterations to its quantitative easing program.

Summary

So we saw inflation basically flat-lining in the US for now, over in the EU inflation appears to be gradually picking up but risks remain. Japan saw less than exciting results in the Q4 reading of the Tankan survey, and the US saw flat housing starts as the housing market appears to be stabilizing somewhat. On the monetary policy front we saw a couple tighten, a few drop, and most hold steady as monetary policy becomes more de-synchronized as the global recovery also becomes more de-synchronized.

Sources
1. US Bureau of Labour Statistics www.bls.gov
2. Eurostat epp.eurostat.ec.europa.eu
3. Bank of Japan www.boj.or.jp
4. US Census Bureau www.census.gov
5. CentralBankNews.info www.centralbanknews.info

Article source: http://www.econgrapher.com/top5graphs18dec.html

Friday, October 15, 2010

Top 5 Economics Graphs of the Week - 16 October 2010

This week we look at the recent trade data out of the US and China, then we look at developments in the US inflation situation and what implications it may have. We also review the inflation situation in the EU before reviewing the US consumer sentiment numbers.

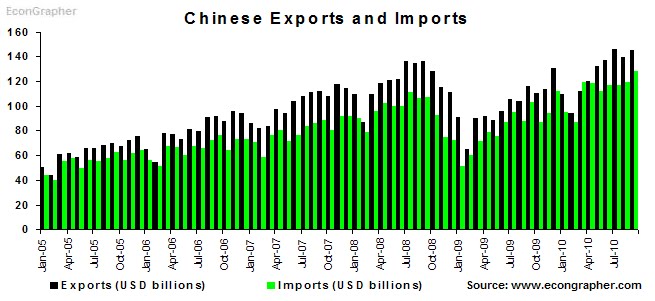
1. China Trade Data
First up is the September trade data from China, imports hit a record high at $128.1 billion (24.1% y/y), and exports of $144.9 billion (25.1% y/y) leaving a trade surplus of $16.9 billion. The September quarter also saw trade rising on a quarterly basis with both exports, imports, and the trade surplus rising vs the June quarter; also both exports and imports hit a quarterly record high. The rise in imports is perhaps one of the most interesting aspects in terms of China's role in the global economy. But of course the part getting much of the attention is the trade surplus...

2. US Trade Data
The other big trade data out this week was from the US; the August trade deficit ballooned out to -$46.3 billion, above consensus -$44.3 billion, and July's -$42.8 billion. This time the drivers of the expansion in the deficit were not just from petroleum goods, the nonpetroleum deficit grew to $35.9 billion from $33.2 billion - signaling a cyclical normalisation of the the US trade deficit. The point is that the US trade balance started to head towards zero because of cyclical factors, but it will need to be driven by structural factors if the US is ever going to see a positive trade balance.

3. US Inflation Situation
Also from the US this week was inflation data, which showed a considerably subdued inflation situation in the US. Month on month headline CPI rose 0.1%, and was unchanged on a core basis. Year on year the headline rate reduced from 1.2% to 1.1%, and the core rate fell to 0.8% from 1.0%. However looking at the chart below the ISM prices sub-indexes from both the PMI and NMI show a relatively mixed story - it says that businesses are reporting paying higher prices, which means either an eventual pick up in inflation or margin compression.

4. Euro Zone Inflation Situation
In Europe inflation increased in August, with the headline rate rising to 1.8% from 1.6% in July, but core staying flat at 1%. The main drivers were transport, alcohol & tobacco, and housing. Of course the usual extremes were seen with Ireland facing deflation of -1.0%, followed by Latvia with a 0.3% annual rate; while at the other end were Greece with 5.7% and Romania at 7.7%. Thus at least on a headline basis inflation is by no means gone in the EU, but the message of a fragile, gradual, and uneven recovery for the EU remains

5. Reuters/University of Michigan Consumer Sentiment
Finally, the US Consumer Sentiment index slipped slightly to 67.9 from 68.2 in August, and below consensus 69. The future expectations index fell to 60.9 form 62.9 previous, and the current conditions index rose to 79.6 from 78.3 previously; showing that consumers are slightly happier about things now and slightly less optimistic about the future. Much of the uncertainty is driven by delays on decisions around tax cuts, but also the general uncertainty that accompanies such recovery as the one we're seeing... and of course all the talk about QE2 (which is really an implicit admission by the fed that things are not looking good) will hardly help.

Summary

So we saw China producing record trade results in the September quarter, with the trade balance rising and also raising eyebrows, but of course the continued rise in imports is one of the most interesting features. On the other side of the coin, the US is seeing a cyclical reversal of the ground it made in reducing its trade deficit - the message is that the US will continue to see trade deficits until structural forces drive change.

On the inflation front the US September results showed an exceedingly subdued trend in inflation, but the price indexes in the PMI indexes suggested that the string of disinflation could be temporary (but much will depend on the course of the recovery). Over in the EU the inflation picture was a bit different, with headline rates moving up (but core remaining flat) as the fragile, gradual, and uneven recovery unfolds.

Back to the US, the consumer sentiment figures showed a mixed situation for consumers as uncertainty related to the strength or otherwise of the economic recovery weighs in (in spite of a relatively healthy retail sales figure). So it will be interesting to see if the Fed effectively throws in the towel with another round of quantitative easing. Watch this space!

Sources
1. China Customs www.customs.gov.cn
2. Bureau of Economic Analysis www.bea.gov
3. Bureau of Labour Statistics www.bls.gov & Institute for Supply Management www.ism.ws
4. Eurostat epp.eurostat.ec.europa.eu
5. Reuters/Univesity of Michigan customers.reuters.com

Article Source: http://www.econgrapher.com/top5graphs16oct.html

Sunday, August 29, 2010

Econ Grapher - Economic Calendar - 30 August 2010

Here's the Economic Calendar for the week commencing the 30th of August 2010. This week there's Q2 GDP results from Canada, Australia, Switzerland, and the EU. And of course given that this week brings the start of September we've got PMI figures out of China, the US, and a range of other countries. The other notables will be S&P/Case-Shiller house prices, US consumer confidence, Canada and Aussie current accounts, an ECB rate non-decision and of course US nonfarm payrolls.

(More commentary follows the table)

Day Time (GMT) Code

Event/Release

Forecast Previous
MON NZD Imports (New Zealand dollars) (JUL) 3.70B 3.51B
MON NZD Exports (New Zealand dollars) (JUL) 3.65B 3.78B
MON AUD Company Operating Profit (QoQ) (2Q) 5.8% 3.9%
MON NZD NBNZ Business Confidence (AUG) 27.9
MON 09:00 EUR Euro-Zone Economic Confidence (AUG) 101.6 101.3
MON 12:30 CAD Current Account (BoP) (Canadian dollar) (2Q) -$10.0B -$7.8B
MON 12:30 USD Personal Income (JUL) 0.3% 0.0%
MON 12:30 USD Personal Spending (JUL) 0.3% 0.0%
MON 12:30 USD Personal Consumption Expenditure Core (YoY) 1.4% 1.4%
MON 23:50 JPY Industrial Production (MoM) (JUL P) -0.2% -1.1%
MON 23:50 JPY Industrial Production (YoY) (JUL P) 14.3% 17.3%
MON 23:50 JPY Retail Trade s.a. (MoM) (JUL) 0.5% 0.4%
MON 23:50 JPY Retail Trade (YoY) (JUL) 3.5% 3.2%
MON 01:30 AUD Retail Sales s.a. (MoM) (JUL) 0.4% 0.2%
MON 01:30 AUD Current Account Balance (Australian Dollar) (2Q) -6500M -16551M
TUE 07:55 EUR German Unemployment Change (AUG) -20K -20K
TUE 07:55 EUR German Unemployment Rate s.a. (AUG) 7.6% 7.6%
TUE 09:00 EUR Euro-Zone CPI Estimate (YoY) (AUG) 1.6% 1.7%
TUE 09:00 EUR Euro-Zone Unemployment Rate (JUL) 10.0% 10.0%
TUE 12:30 CAD Quarterly GDP Annualized (2Q) 2.5% 6.1%
TUE 13:00 USD S&P/Case-Shiller Composite-20 s.a. (MoM) (JUN) 0.35% 0.47%
TUE 13:00 USD S&P/Case-Shiller Composite-20 (YoY) (JUN) 3.50% 4.61%
TUE 14:00 USD Consumer Confidence (AUG) 51.0 50.4
TUE 18:00 USD FOMC Meeting Minutes (AUG 31)
TUE 01:00 CNY Purchasing Managers Index Manufacturing (AUG) 51.5 51.2
TUE 01:00 CNY HSBC Manufacturing PMI 49.4
TUE 01:30 AUD Gross Domestic Product (QoQ) (2Q) 0.9% 0.5%
TUE 01:30 AUD Gross Domestic Product (YoY) (2Q) 2.8% 2.7%
TUE 03:00 NZD ANZ Commodity Price (AUG) -0.8%
WED 07:55 EUR German PMI Manufacturing (AUG F) 58.2 58.2
WED 08:00 EUR Euro-Zone PMI Manufacturing (AUG F)
WED 14:00 USD ISM Manufacturing (AUG) 53.0 55.5
WED 14:00 USD ISM Prices Paid (AUG) 56.0 57.5
WED 01:30 AUD Trade Balance (Australian dollar) (JUL) 3100M 3539M
THU 05:45 CHF Gross Domestic Product (QoQ) (2Q) 0.8% 0.4%
THU 05:45 CHF Gross Domestic Product (YoY) (2Q) 2.6% 2.2%
THU 09:00 EUR Euro-Zone GDP s.a. (QoQ) (2Q P) 1.0% 1.0%
THU 09:00 EUR Euro-Zone GDP s.a. (YoY) (2Q P) 1.7% 1.7%
THU 09:00 EUR Euro-Zone Producer Price Index (YoY) (JUL) 3.9% 3.0%
THU 11:45 EUR ECB Interest Rate Decision (SEP 2) 1.00% 1.00%
THU 14:00 USD Pending Home Sales (MoM) (JUL) -1.5% -2.6%
THU 14:00 USD Factory Orders (JUL) 0.5% -1.2%
THU EUR German Retail Sales (MoM) (JUL) 0.5% -0.9%
FRI 07:15 CHF Consumer Price Index (YoY) (AUG) 0.4% 0.4%
FRI 08:00 EUR Euro-Zone PMI Services (AUG F) 55.6 55.6
FRI 08:00 EUR Euro-Zone PMI Composite (AUG F) 56.1 56.1
FRI 09:00 EUR Euro-Zone Retail Sales (MoM) (JUL) 0.2% 0.0%
FRI 12:30 USD Change in Non-Farm Payrolls (AUG) -105K -131K
FRI 12:30 USD Unemployment Rate (AUG) 9.6% 9.5%
FRI 12:30 USD Change in Private Payrolls (AUG) 46K 71K
FRI 14:00 USD ISM Non-Manufacturing Composite (AUG) 53.5 54.3

This week we've got more Q2 GDP results out; first up will be Canada, which is expected to show an annualised quarterly growth rate of 2.5% vs 6.1% the previous quarter. Then there's Australia, expected to shrug-off the election issues and clock up 0.9% q/q for Q2. Then there's the EU data, with the Swiss expected to show 0.8% q/q and the wider EU with 1.0%. More or less all lining up with the post-recession recovery bounce, but the key question will be who's still growing come Q3 and Q4... because the easy part of the recovery is over, time for the real hard work to begin!

Now there are a few countries releasing PMI data this week, but no doubt all eyes will be on the two juggernauts; China and the US. Both are going to play critical roles in the course of the global economy over the coming period. China is expected to show a slight rebound - and what ever the figure is it will send strong signals (a weaker figure will confirm the slowdown, a stronger figure will suggest continued growth, and something in between will leave uncertainty in its wake). The US; manufacturing is the strong point, so let's watch this one closely - will the last bastion of the US economic recovery fall?

Another area of interest this week will be the international trade and capital flows; Canada will report its Q2 current account balance, and is expected to show a larger deficit... then Aus will also release its Q2 figure but a smaller deficit is expected. New Zealand will release its trade figures early Monday; with imports expected to jump above exports for the first time in about a year, and Aus will release its July trade balance later in the week.

Elsewhere there's the increasingly important S&P Case Shiller home price index, and US consumer confidence numbers - both will give important insights into the course of the downward spiral of the US economy; as will the nonfarm payroll figures on Friday. In Japan there's industrial production figures and retail trade - both of importance for the Japanese economy which is sitting at the watershed. And of course last but not least there's the ECB monetary policy announcement - not a huge probability of anything significant here, but watch for their analysis anyway... the US Fed will be putting out its recent meeting minutes too.

So as always, have a great week, watch out for surprises, and stay tuned for updates...

Sources
DailyFX www.dailyfx.com/calendar
Forex Pros www.forexpros.com/economic-calendar/
Forex Factory www.forexfactory.com/calendar.php
Bloomberg www.bloomberg.com
+various statistics websites and central bank websites for verification


Article Source: http://www.econgrapher.com/30aug-calendar.html