Showing posts with label China economic outlook. Show all posts

Sunday, December 2, 2012

Bear No More - It's Time To Get Beta In China


The Chinese stock market has had a volatile year, initially rallying before slumping as concerns about a hard landing culminated in speculation on the end of the Chinese economic growth model. If history shows us anything it's that people will always overreact; on the down side and the upside. But is it an overreaction to still be bearish on China?
In order to answer this question, we need to review a number of key economic and market themes. The bottom line is that there is a compelling outlook, but it's not as simple as it may seem.

Monday, June 4, 2012

China Update - Housing Market and Manufacturing


The first bits of data that come out of China each month are the PMI (a measure of manufacturing) and the Soufun 100 Index (a measure of house prices). The housing sector and manufacturing sector remain critical to the near term prospects of China's overall economy and macro policy positioning. So with these two data points you can get a leading view on how China's economy. And what do they say?


Full Story: http://www.alleconomists.com/2012/06/china-update-housing-market-and.html

Tuesday, January 24, 2012

China Economic Update: The Softest of Landings

China recently released its major regular economic data dump, and the results were well, remarkably good. GDP growth tapered off ever so gently, retail sales growth accelerated, industrial production chugged along, fixed asset investment slowed slightly, trade volumes held up, property prices continued a gentle descent, and loan growth showed a cautious but somewhat easier pace, and inflation continued to ease-off. In essence the December data was consistent with a smooth and steady landing, with all the right spots showing the right signs. But where to next? Can we expect a continued pleasant ride, or are we on the cusp of turbulence? And what are the implications for investors?

Full story: http://seekingalpha.com/article/321399-china-economic-update-the-softest-of-landings

Friday, October 21, 2011

China Update: Something For Everyone

China pretty much wrapped up its key economic data releases this week. As always there's plenty of stuff for everyone amongst all the various data-points and sources. So this article attempts to digest some of the data and figure out what it means for the near and medium term outlooks for China's economy and markets.

Saturday, October 8, 2011

China Property Update - What's going on?

Just a quick update on the Chinese property market. I tend to keep one eye on the Soufun 100-city index, and the other eye on the NBS 70-city data. Of course it is somewhat fraught to look at an aggregated-up index over such a vast and diverse country, but the trend is still very important for macro analysis of China given the strong link of fixed asset investment, government revenue, private wealth, and of course the banking and finance sector to real estate prices and activity.

So in this update I'll show you the Soufun graphs with the September data, and pop in a few other relevant bits and pieces I've happened upon.

First Glance: I have been expecting a gradual turnaround in real estate prices; and slower gains are now looking to be turning into small losses. A key question, and a key risk area for China, will be the extent to which the property market slows. A route in prices wont be the end of China but it will mark a temporary end to its post-bubble-government-reflation-bubble.

So, onto the Soufun (maybe not 'so-fun'?) data. In September prices fell a whopping -0.03% to an average 8,877 yuan per square meter. The current level is 313 yuan higher than the start of the year, and up about 6.1% from the same time last year.
Prices rose in 54 out of 100 cities, and fell in 44 cities (2 unch). The last point is noticeable - the graph below charts the no. of cities which recorded rising prices, and yes, that does look like a trend.
So, the Soufun data so looks like the start of a trend, but of course we'll need to see another couple of months before we can rule out fluctuations. Also the NBS data will be out - usually around the 18/19th of the month, so it will be good to check that dataset for confirmation.

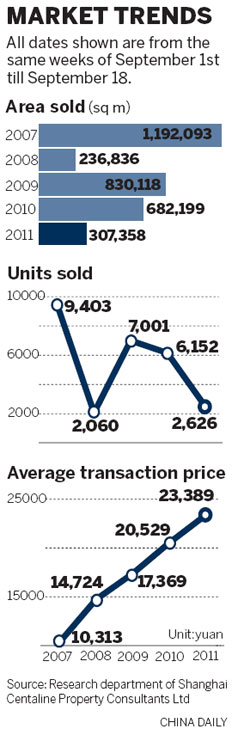
Now, onto another couple of charts I found in a China Daily article. The data in the charts are for 1-18 Sep in the relevant years. Key points: volume has tanked compared to levels seen during the the pre-2008 bubble, and the post-2008 reflation bubble. Prices have doubled over 5 years (but then incomes have also doubled over the past 5 years).
If you saw a stock chart with a surging price, and with volume which trailed off to low levels, what would you think? The answer has to be that the market is getting a bit fatigued at the current price level. But having said that, I still think there are fundamental forces which should logically support higher prices (e.g. urbanization, rising incomes, the culture part of needing to own a house, demand for property as a store of value/inflation hedge, etc).

The dual forces of price exhaustion and government policy aimed at improving house price affordability, will likely continue to weigh on property prices in the near term though. I struggle to see a catastrophic unwinding, rather a period of price dullness; with the market naturally taking a breather, and the government breathing down the neck of developers and bankers.

To me it seems there is enough fundamental strength to support a baseline demand and price level for property in China. But like many, I am paying a lot of attention to the "landing" of China, and whether it be soft, hard or something in between. In any case the market will be pricing (or overpricing) any further signs of a harder landing, or more relevantly - the likelihood of the formation of perfect storms; and that is a non-zero probability risk.

Proceed with caution (and optimism).

Econ Grapher

Saturday, July 16, 2011

China Economic Check-up: Nope, no hard landing yet folks

China just released its June numbers, with 3 separate official sources delivering banking and money stats, international trade stats, and the core economic data. The June GDP numbers were pretty strong in the scheme of things, and the rest of the data pointed to a high likelihood of persistence in economic strength, at least in the medium term. In this article we explore some of the key data points, and come to the conclusion that a hard landing/significant slow down is a not a 2011 story...

1. China GDP
China managed to show year on year GDP growth of 9.5% in the June quarter, which was slightly lower than the 9.7% it showed in the previous quarter and 10.3% in June 2010, and compares to a 10-year average of about 9.4%. So in the scheme of things GDP growth does not show a significant degree of slowing. However, if you redefined recession for China as passing below the long term average growth rate - rather than descending into the negatives, then China could dip just below that line later this year. So, in spite of a succession of tightening moves, e.g. the PBOC raised interest rates earlier this month, growth has not yet taken a hit, and it makes sense because the dual forces of strong underlying fundamentals as well as strong sources of manufactured growth e.g. social housing, persist - so sorry folks, no slow down or hard landing in 2011.

2. China inflation
But one area that persists as a weak-point or vulnerability is the surging inflation numbers. Inflation hit 6.4% in June (I was expecting about 6.5%), with most of that coming from food price inflation (14.4%), and non-food static around 3%. This remains a risk because if it gets out of control then it poses stability risks, but more importantly, persistently high and rising inflation will put pressure on policy makers to tighten the screws further on monetary policy - that could slow things down a bit more, and certainly put some headwinds in front of Chinese equities. But I'm seeing signs that this could be the peak - there are a few people out there that have been forever calling the peak - but things like a turn in the prices index part of the PMI, the tightening done to date, and market responses to high prices. The Yuan could be worked harder to achieve lower inflation outcomes, but it's no silver bullet either. I see inflation as a risk, but I can see a scenario where inflation starts to taper off.

3. PMI and Industrial Production
The industrial production figure was a slight surprise in that it broke from where the PMI suggested it should go. The figure came in at 15.1% y/y, up from 13.3% in May, 13.7% in June 2010. The official PMI dropped to 50.9 for June, from 52 in the previous month - this is one of the main areas that people have been pointing to for signs of a slowdown, and fair enough - new orders have trailed off , but still above the expansionary 50 point mark. So it's mixed signals from this one, July will tell if June was a quirk or a sign that the bottom has been hit on the slowing in industrial production growth - so watch this space.

4. International Trade
China reported another record month for exports, 162B for June, while imports trailed off some to 139.7B (high of 152B in March). So what are the messages from the trade results?, first off, net exports were positive for the quarter (about 47B vs 0 in the March quarter), so there was a decent positive GDP contribution from trade during June. So the upward trend in exports are a positive sign for China's economy, but also indicate a certain degree of strength in global demand, on the imports side, it almost sends a signal of lower import demand, some of this may be related to a tapering off in commodity prices, but it is something to keep an eye on.

5. New Loans
New loans in China has been the gasoline that has been fueling the heat in the property market, as well as wider influences such as inflation and general growth. There has been a range of moves designed to cap lending growth (including RRR hikes and tougher lending rules), but new loans are still going strong, YTD new loans are about 4 trillion yuan (about 5 trillion in H1 2010, and close to 8 trillion in H1 2009). It's no secret that this rapid expansion in lending is a risk area, and a lot of China bears have been pointing to this, as well as the local government debt issues. A lot of water needs to go under the bridge and a lot of info needs to come to light before the full view of what's really going on in China's property and lending markets come into full light, but for now, the still elevated rate of loan growth remains stimulatory for both the economy and property prices (also note on property prices, real income per capita rose about 7.6% in June y/y, compared to property prices about 5-6% y/y).

Summary

So, as always it was interesting to digest all the info in the June economic data reports from China. The high level view is that China's economy is still going strong, it is strong in many areas, and appears to have broad fundamental strength. Aside from fundamental strength China's economy is also boosted by expansionary policies such as the 10 million unit social housing project for this year - which will be loaded mostly in H2 in terms of construction starts. But aside from stimulatory polices and broad based strength, there are inevitably risk areas too, such as the overheating and inflation risks, the property market risks, and the local government debt risks. Evidence points to none of these coming squarely home to roost in 2011. If there's a slow down coming in China, it's a 2012 or 2013 story - so, no hard landing yet folks!

Sources
1. National Statistics Bureau www.stats.gov.cn
2. National Statistics Bureau www.stats.gov.cn
3. CFLP www.chinawuliu.com.cn & Markit/HSBC www.markiteconomics.com & National Bureau of Statistics www.stats.gov.cn
4. China Customs www.customs.gov.cn
5. People's Bank of China www.pbc.gov.cn

Monday, May 30, 2011

Brits Get Rich in China

While I was whittling my precious weekend hours away I stumbled on to a finance documentaries website and found a very interesting documentary on China. The film is called "Brits Get Rich in China" and follows three entrepreneurs as they go to China to make their fortunes. As any one familiar with China can imagine, anything like this makes for very interesting viewing!

I wont give too much away, but I would highly recommend it to anyone who's thinking about doing business in China, or with Chinese businesses - and that includes investing. Sure, it is only anecdotal evidence, but it just shows that when you go to do business (or invest) in a place like China it pays to know what you're doing, or at least to know someone who knows what they're doing.

Business is tough in China, Chinese are tough, they play a hard business game. If you go in expecting to do business like you would in likes of the US or UK, to some degree you're right, but a lot of aspects are accentuated so you need to sharpen up your act. You need to carry a healthy mistrust, you need to know at least some of the language and customs (more language skills are better) or have a very trustworthy partner who does.

But though business and investing in China can be fraught with risk and challenge, it doesn't mean it's not worth going. As you'll see the people in the documentary the rewards can certainly make it all worth it (and then some). But then that's what investing and business is all about isn't it? Taking risk and doing the hard yards to achieve your dreams.

Watch the documentary here: http://www.financedocumentaries.com/2011/05/brits-get-rich-in-china.html

Friday, April 15, 2011

Top 5 Economics Graphs of the Week - 16 Apr 2011

This week the focus goes entirely to China, with an overview of some of the key economic statistics released over the past week. We look at the GDP results, then summarize the inflation situation, followed by a look at retail sales growth and industrial production, finishing up with a snapshot of new loans.

1. GDP
China reported 1Q 2011 GDP growth of 9.7%, basically flat on the previous quarter's 9.8% (11.9% in 1Q 2010), and above consensus expectations of about 9.5%. China's economy is still being kept strong by surging investment, with fixed asset investment rising 25% in March to CNY 3.95 trillion, boosted by construction. Trade volumes are also running relatively strong. But GDP is only one part of the Chinese economic picture...


2. CPI
China reported inflation of 5.4% year on year in March, up from 4.9% in February (March 2010 2.4%), and above consensus 5.2%. Meanwhile the People's Bank of China Price Expectations Index dropped off to 72.8 from 82.7, further signaling a peak in inflation. With the People's Bank of China raising its main policy rate to 6.31% and average required reserve ratio to 20%, it is increasingly likely that inflation will begin to moderate, particularly as the effect of food supply shocks begin to wane. However with the Chinese economy still going strong and loan growth and money supply growth still at relatively high levels (not to mention loose fiscal policy) the all-clear cannot yet be sounded on inflation in China.

3. Retail Sales
China saw retail sales fall -1% from February where it fell -10% (-8% in March 2010). While on a year on year basis retail sales rose 20% (15% in March 2010) to 1.36 trillion yuan. Retail sales results were largely distorted by the holiday period, but the firm upward trend remains. What's more, the annual growth rate is much higher at present than during 2009. On a related note Per Capita Cash Income of Rural Households rose 14.3% year on year to 2,187 yuan, while Per Capita Disposable Income of Urban Households increased 7.1% to 5,963 yuan.

4. Industrial Production
China reported industrial production expanding 14.8% in March compared to last year, off slightly from 14.9% in February (18.1% in March 2010). Meanwhile the PMI indexes both rose marginally, with the official CFLP PMI rising to 53.4 from 52.2 and the HSBC/Markit PMI rising to 51.8 from 51.7 (and the non-manufacturing jumping to 60.2 from 44.1). The Chinese industrial engine is still running strong, particularly with the lifting of the energy limits of late last year. Demand is still running strong from infrastructure and construction projects, consumer spending, and in particular, export demand.

5. New Loans
Chinese banks lent a further CNY 680 billion during March, up from 535 billion in February (577 billion in March 2010), bringing the YTD total to 2.25 trillion. On a related note money supply continued to expand, with M2 up 16.6%, M1 up 15.0%, and M0 up 14.8% year on year. So the monetary part of the equation is still running relatively accommodative to economic growth. This despite moves to tighten monetary policy via several increases in the interest rate and required reserves to pull down inflation. The main lever the People's Bank of China has left to pull down inflation is letting its currency appreciate (which would also create somewhat of a wealth effect for Chinese consumers - which would be beneficial for outward investment flows and purchases).

Summary

So, one quarter into the new year and the key themes for China remain growth and inflation. The Q1 result showed the economy still surging along thanks to large scale construction projects, strong export volumes, and relatively robust consumer spending driven by rising incomes. But the key risk remains inflation. Inflation is a key risk for social stability, the sustainability of economic growth, and it is perhaps the number one catalyst for investment markets. So, as noted previously, it will pay to carefully and closely watch the course of growth and inflation in China this year.

Sources
1. National Bureau of Statistics www.stats.gov.cn
2. National Bureau of Statistics www.stats.gov.cn & People's Bank of China www.pbc.gov.cn
3. National Bureau of Statistics www.stats.gov.cn
4. CFLP www.chinawuliu.com.cn & Markit/HSBC www.markiteconomics.com & National Bureau of Statistics www.stats.gov.cn
5. People's Bank of China www.pbc.gov.cn

Article Source: http://www.econgrapher.com/top5graphs16apr11.html

Monday, March 28, 2011

Does It Make Sense to Be Bearish on China?

The China bear story is overdone. Through most of this year and much of last year, it has been popular to write stories about how China’s real estate market is about to crash, and how there’s countless ghost cities, and how it will be such a struggle for China to shift to a domestic demand-led economy. Sure, there have been some interesting signals and data emerging, but in all, concerns about an imminent market crash are likely premature.

http://seekingalpha.com/article/260391-does-it-make-sense-to-be-bearish-on-china

Friday, March 11, 2011

Top 5 Economics Graphs of the Week - 12 Mar 2011

This week the focus is on China and monetary policy. First up we look at China's vital stats for February: inflation, retail sales, industrial production, and international trade. Some of the data is a little distorted due to the holiday season in China, but there are still some interesting insights. Finally we check out some of the seven interest rate changes that various central banks around the world announced over the past week.

1. China Inflation
China reported inflation of 4.9% in February, the same figure as in January. The figure was largely driven by food price inflation, with the prices of foodstuffs rising 11.0% but with non-foodstuffs also showing signs of life, rising 2.3% year on year. The other key category was housing, which rose 6.1%, showing the Chinese housing market is still chugging along, with a mind boggling rate of new buildings under way e.g. the government's 10 million unit social housing program. Overall, food prices are still the key driver, so it will be interesting to see whether food prices may normalize following some of the short-term supply disruptions. But there are also significant wages, capacity, and aggregate demand aspects to inflation, so it's likely that the People's Bank of China has some further tightening up its sleeve.

2. China Retail Sales
February retail sales slumped as expected due to the seasonal effect of the Chinese new year holiday period. However the February figure alone was higher than September 2010 (1.38 trillion yuan vs 1.35 trillion), so the upward trajectory is still firmly entrenched. And it's unsurprising, over the past 5 years urban per capita incomes have doubled to about 20,000 yuan in the 2010 year. The only thing to watch though is the rate of growth has tapered off a bit - this will be a key indicator to monitor over the next few months.

3. China Industrial Production
China recorded growth in industrial production of 14.9% year on year in February (compared to 12.8% growth in February 2010). In terms of sectors the fastest growing were General Purpose Machinery (22.8%), and Nonmetal Mineral Products (18.9%), while the slowest growing sectors were Textiles (8.5%), and Transport Equipment (12.8%). So the message was, basically China's industrial engine is still running strong, and the PMI figures have flagged this. February PMI was about 52 on both measures - indicating expansion. Industrial production is likely to continue to find strength from export demand, property construction demand, and government infrastructure spending demand. But to be sure, over time industrial production will increasingly find strength from domestic demand e.g. in the case of car sales - with massive sales of automobiles in China.

4. China International Trade
On international trade, China reported lower volumes and a -$7.3 billion deficit as seasonal factors bit into trade volumes. However, looking through the seasonal factors, on a rolling quarterly basis, and compared to last year, here's how it would stack up: in the 3 months to February 2010 exports were $400m vs $335m, imports were $390m vs $295m, and the surplus was $12.5m vs $40m. So the volumes are definitely up, but there is some tangible reduction in the trade surplus. Of course some are pointing to this alleviating some of the Yuan debate in the short term, but the PBOC is already starting to acknowledge the role of the Yuan in managing inflation, so watch this space.

5. Monetary Policy Review
On monetary policy, those that raised interest rates included: Thailand +25bps, Kazakhstan +50bps, Korea +25bps, Serbia +25bps, and Peru +25bps. Meanwhile New Zealand -50bps and Trinidad & Tobago -25bps reduced their main policy rates. The rate cuts were the exception, and New Zealand even more of an exception, as the move was motivated as a response to the earthquake. For the most part though the theme was a collective desire to anchor inflation expectations and avoid the second round effects of rising commodity prices. The UK notably didn't do anything, in contrast to the ECB - which suggested rates could rise as early as April. But then we wont be able to know their rationale until the Bank of England meeting minutes come out in a week or so.

Summary

So we saw inflation remaining high in China, which affirms suspicions around a swath of fundamentals that point to broad-based inflationary pressures. On retail sales, consumer spending maintained upward momentum overall, despite the seasonal effects of holidays. Likewise, industrial production showed no let-up, with a variety of factors supporting further strength in China's industrial engine over the medium term. As for international trade, a few quirks saw China report a trade deficit in February, but that's likely to quickly reverse, but there are some interesting trends unfolding. Looking more broadly at the world, the main theme of monetary policy decisions over the past week was the old chestnut of emerging market inflation, with banks looking to preempt second round effects of rising commodity prices. Question is, when's the PBOC's next move?

Sources
1. National Bureau of Statistics www.stats.gov.cn & People's Bank of China www.pbc.gov.cn
2. National Bureau of Statistics www.stats.gov.cn
3. National Bureau of Statistics www.stats.gov.cn
4. China Customs www.customs.gov.cn
5. CentralBankNews.info www.centralbanknews.info

Article Source: http://www.econgrapher.com/top5graphs12mar11.html

Saturday, December 11, 2010

China Economic Update - 12 Dec 2010

China released its main economic indicators for November over the weekend, following the decision by the People's Bank of China to raise the required reserve ratio another 50bps. This article reviews some of the key data points in the release. We look at inflation, retail sales, industrial production, money supply growth, and new loans.

1. China Inflation
China saw a further spike in inflation in November with the year on year increase in the CPI rising to 5.1% from 4.4% in October. As with October much of the inflation was coming from food prices e.g. "foodstuff" inflation was 11.7% y/y and "non-foodstuff" was 1.9%. The figure came in higher than an expected 4.7% and provides a bit of justification to the PBOC lifting the RRR on Friday, but the question remains; will it need to do more? And how can it address the food price inflation issue? One easy answer could be to let the yuan appreciate and then import cheaper food, but then things are generally never as easy as they seem.

2. Loan Growth
In a similar vein, loan growth came in at 564 billion yuan vs 588 billion in October, pushing the total new loans within inches of the full year quota of 7.5 trillion yuan. So banks will either have to just go over quota - not sure how practical that is, or wait until existing loans are repaid before extending new loans over December. As for next year, in line with the "prudent" monetary policy rhetoric the quota is likely to be a little lower, possibly 6 trillion yuan. But keep watching this space - we all know what excessive loan growth can lead to (i.e. US, et al).

3. Retail Sales
Retail sales grew again around 18 or 19%, but dipped slightly month on month (seasonal) to 1.39 trillion yuan in November. Again one of the fastest growing categories year on year was "Gold and Silver Jewelry" at 67% (totaling 11.5 billion in Nov or 113.7 billion YTD), which is interesting; is it a wealth effect? are lots of people getting married? or are the Chinese searching for stores of value and inflation hedges? Probably the latter. On volume, automobiles and petroleum and related have dominated spending.

4. Industrial Production
Industrial production picked up slightly to 13.3% against 13.1% in Oct. The fastest growing sectors were general purpose machinery (19%), transport equipment (18.1%) nonmetal mineral products (18%), and electrical machinery & equipment (17.4%). So the industrial sector is still cranking away, churning out cars and various other machines and equipment. And given the record exports number in November it's likely that both external, but predominantly internal demand will sustain activity in the medium term (include government in the internal part).

5. Money Supply
Finishing up with money supply, M2 grew at 19.5%, M1 22.1%, M0 16.3%. Basically money supply growth is still carrying on at a relatively elevated pace, and this will put some pressure on inflation (but some money supply growth is needed). It's also worth at this juncture pointing out where some of the key rates are at, the PBOC's policy rate is 5.56% (the bank lifted it 25bps in October), the RRR is 18.50% (from the 20th of Dec), and the government bond rate was 3.96% at the end of Nov (up about 60bps since Sep, having not changed much off an average about 3.40% Jan-Sep). Monetary policy will likely be a hot topic in China in the short-medium term, but let's hope they get inflation under control and achieve a sustainable growth outcome.

Summary

It's always a good chance to get a feel for where the Chinese economy is when they release the monthly main economic indicators. Indeed, I always try to expand the range of indicators and data sources when it comes to analyzing China e.g. the Manpower employment survey. But anyway we can takeaway some conclusions from this review of the November data. First of all the rate of inflation is increasing, and it appears to be a tough problem to tackle. Second, loan growth and money supply growth are still going strong, and likely aren't helping the inflation fighting effort. Third, there is still signs of a pretty strong economy e.g. in the retail sales stats and the industrial production stats. So it seems, given relative economic strength that the authorities will have room to maneuver in bringing inflation down - but there is a palpable risk of overdoing things or forcing a slowdown (but then isn't that better than blowing a bubble?).

Sources
1. National Bureau of Statistics www.stats.gov.cn & People's Bank of China www.pbc.gov.cn
2. People's Bank of China www.pbc.gov.cn
3. National Bureau of Statistics www.stats.gov.cn
4. CFLP www.chinawuliu.com.cn & Markit/HSBC www.markiteconomics.com & National Bureau of Statistics www.stats.gov.cn
5. People's Bank of China www.pbc.gov.cn


Article Source: http://www.econgrapher.com/12dec-china.html

Economic Calendar - 11 December 2010

Here's the Economic Calendar for the week commencing the 12th of December 2010. This week China dominates the data again, with the monthly main economic indicators on Monday, Money supply and lending on Wednesday, and FDI on Thursday. The Fed meeting is also on this week, and on that note CPI, PPI and capacity utilisation data for the US is also due out. There's also the Swiss National Bank interest rate decision and Japan's quarterly Tankan survey.

(More commentary follows the table)

Date GMT Country/
Currency
Event Forecast Previous
SUN 02:00 CNY Producer Price Index (YoY) (NOV) 5.10% 5.00%
SUN 02:00 CNY Consumer Price Index (YoY) (NOV) 4.70% 4.40%
SUN 02:00 CNY Retail Sales (YoY) (NOV) 18.60% 18.60%
SUN 02:00 CNY Industrial Production (YoY) (NOV) 13.00% 13.10%
SUN 02:00 CNY Fixed Assets Inv Urban YTD YoY (NOV) 24.40% 24.40%
MON 13:30 CAD Capacity Utilization Rate (3Q) 75.80% 76.00%
MON 21:00 NZD REINZ Housing Price Index MoM% (NOV)
-0.90%
MON 21:45 NZD Retail Sales (MoM) (OCT) -0.80% 1.60%
MON 21:45 NZD Retail Sales Ex-Auto (MoM) (OCT) -1.00% 1.60%
MON 04:30 JPY Industrial Production (YoY) (OCT F)

MON 04:30 JPY Industrial Production (MoM) (OCT F)
-1.80%
MON 04:30 JPY Capacity Utilization (MoM) (OCT F)
-1.10%
TUE 06:30 EUR French Consumer Price Index (YoY) (NOV) 1.60% 1.60%
TUE 09:30 GBP Consumer Price Index (MoM) (NOV) 0.30% 0.30%
TUE 09:30 GBP Consumer Price Index (YoY) (NOV) 3.20% 3.20%
TUE 09:30 GBP Core Consumer Price Index (YoY) (NOV) 2.70% 2.70%
TUE 10:00 EUR Euro-Zone Industrial Production w.d.a. (YoY) 7.60% 5.40%
TUE 10:00 EUR Euro-Zone Industrial Production s.a. (MoM) 1.30% -0.80%
TUE 13:30 USD Producer Price Index (MoM) (NOV) 0.50% 0.40%
TUE 13:30 USD Producer Price Index (YoY) (NOV) 3.30% 4.30%
TUE 13:30 USD PPI Ex Food & Energy (YoY) (NOV) 1.20% 1.50%
TUE 13:30 USD Advance Retail Sales (NOV) 0.60% 1.20%
TUE 13:30 USD Retail Sales Less Autos (NOV) 0.70% 0.40%
TUE 13:30 USD Retail Sales Excluding Auto & Gas (NOV) 0.60% 0.40%
TUE 19:15 USD FOMC Rate Decision 0.25% 0.25%
TUE 23:50 JPY Tankan Large Manufacturers Index (4Q) 3.00 8.00
TUE 23:50 JPY Tankan Non-Manufacturing Index (4Q) 0.00 2.00
TUE 23:50 JPY Tankan Large Manufacturers Outlook (4Q) 0.00 -1.00
TUE 23:50 JPY Tankan Non-Manufacturing Outlook (4Q) -3.00 -2.00
TUE 23:50 JPY Tankan Large All Industry Capex (4Q) 2.60% 2.40%
TUE 02:00 CNY Conference Board China Leading Index

WED 05:00 CNY Money Supply - M0 (YoY) (NOV)
16.60%
WED 05:00 CNY Money Supply - M1 (YoY) (NOV) 21.60% 22.10%
WED 05:00 CNY Money Supply - M2 (YoY) (NOV) 19.20% 19.30%
WED 05:00 CNY New Yuan Loans (NOV) 550.0B 587.7B
WED 09:30 GBP Jobless Claims Change (NOV) -3.0K -3.7K
WED 13:30 USD CPI Ex Food & Energy (YoY) (NOV) 0.60% 0.60%
WED 13:30 USD Consumer Price Index (YoY) (NOV) 1.10% 1.20%
WED 14:15 USD Capacity Utilization (NOV) 75.0.% 74.80%
WED 14:15 USD Industrial Production (NOV) 0.30% 0.00%
THU 05:00 CNY Actual FDI (YoY) (NOV) 10.80% 7.90%
THU 08:15 CHF Industrial Production (YoY) (3Q) 5.00% 7.80%
THU 08:30 CHF Swiss National Bank Rate Decision 0.25% 0.25%
THU 09:00 EUR Italian Consumer Price Index (YoY) (NOV F) 1.80% 1.80%
THU 09:30 GBP Retail Sales (YoY) (NOV) 1.40% 1.20%
THU 09:30 GBP Retail Sales with Auto Fuel (YoY) (NOV) 0.70% -0.10%
THU 10:00 EUR Euro-Zone CPI - Core (YoY) (NOV) 1.10% 1.10%
THU 10:00 EUR Euro-Zone Consumer Price Index (YoY) 1.90% 1.90%
THU 13:30 USD Housing Starts (NOV) 550K 519K
THU 13:30 USD Building Permits (NOV) 558K 552K
THU 13:30 USD Current Account Balance (3Q) -$126.0B -$123.3B
THU 13:30 USD Housing Starts (MoM) (NOV) 6.00% -11.70%
THU 13:30 USD Housing Starts (NOV)
519K
FRI 10:00 EUR Euro-Zone Trade Balance (euros) (OCT) 2.5B 2.9B
FRI 10:00 EUR Euro-Zone Construction Output (YoY) (OCT)
-8.10%
FRI 15:00 USD Leading Indicators (NOV) 1.10% 0.50%

As noted China dominates this week, first up is the main economic indicators for November; CPI inflation is expected to come in at 4.70% and given the People's Bank of China raised the RRR again on Friday it will probably be a high figure. Also out is retail sales, industrial production, and fixed asset investment - all expected to come in at similar levels to October. On the monetary stats, M2 & M1 are both expected to grow around 20%, and new loans is likely to come in over 500 billion yuan, pushing through the 7.5 trillion quota. Foreign direct investment is also expected to pick up.

Over to the US, the FOMC meets on Tuesday and there shouldn't be any surprises, as always keep a close eye on what they say, especially around alterations to quantitative easing. Inflation is expected to slow further to 1.1% yoy, on a CPI basis with core flat, on a PPI basis consensus is for further drops, and capacity utilisation likely little changed. So the challenge of raising inflation remains for the Fed, should they be doing more?

Elsewhere, the Tankan survey from Japan will be one to catch as a good gauge on how the Japanese economy is tracking through the 4th quarter. Other notables are UK CPI (expect flat), EU industrial production (slight pick up), US retail sales (core up), Swiss National Bank (no change), US housing starts (slight improvement), and a handful of others (see the table above).

So as always, have a great week, watch out for surprises, and stay tuned for updates...

Sources
DailyFX www.dailyfx.com/calendar
Forex Pros www.forexpros.com/economic-calendar/
Forex Factory www.forexfactory.com/calendar.php
Bloomberg www.bloomberg.com
+various statistics websites and central bank websites for verification


Article Source: http://www.econgrapher.com/12dec-calendar.html