Leafing through reports from the IMF (International Monetary Fund) and BIS (Bank for International Settlements), I came across a few interesting charts and comments on inflation. Not to over do the inflation theme, it's worth highlighting some of the trends in inflation around the world because of the significant importance it has on how global economic prospects will evolve. Perhaps more importantly, the course of inflation will have significant financial market and investing implications.
http://seekingalpha.com/article/259106-rising-inflation-poses-a-threat-to-investment-yields
Showing posts with label IMF. Show all posts
Showing posts with label IMF. Show all posts
Sunday, March 20, 2011


Saturday, October 16, 2010
Economic Calendar - Week Starting 17 October 2010
Here's the Economic Calendar for the week commencing the 17th of October 2010. This week China takes the stage with its monthly main economic indicators release; of course as it is also a quarter end there will be GDP data as well. Elsewhere the Bank of Canada will announce its interest rate decision on Tuesday, and the RBA and BoE will release monetary policy meeting minutes and the Fed will release its Beige Book. Also on the radar is the G-20 Summit of Finance Ministers and Central Bank Governors on Thursday.
(More commentary follows the table)
| Day | Time (GMT) | Code | Event/Release | Forecast | Previous |
| SUN | 21:45 | NZD | Consumer Prices Index (QoQ) (3Q) | 1.0% | 0.3% |
| SUN | 21:45 | NZD | Consumer Prices Index (YoY) (3Q) | 1.5% | 1.8% |
| MON | 13:15 | USD | Industrial Production (SEP) | 0.2% | 0.2% |
| MON | 13:15 | USD | Capacity Utilization (SEP) | 74.8% | 74.7% |
| MON | 00:30 | AUD | Reserve Bank's Board October Minutes | ||
| TUE | 08:00 | EUR | Euro-Zone Current Account n.s.a. | 3.7B | |
| TUE | 08:00 | EUR | Euro-Zone Current Account s.a. | -3.8B | |
| TUE | 09:00 | EUR | Euro-Zone Construction Output (YoY) | -7.5% | |
| TUE | 12:30 | USD | Housing Starts (SEP) | 583K | 598K |
| TUE | 12:30 | USD | Housing Starts (MoM) (SEP) | -2.6% | 10.5% |
| TUE | 12:30 | USD | Building Permits (SEP) | 575K | 571K |
| TUE | 12:30 | USD | Building Permits (MoM) (SEP) | 0.7% | 1.8% |
| TUE | 13:00 | CAD | Bank of Canada Rate Decision | 1.00% | 1.00% |
| TUE | 21:00 | USD | ABC Consumer Confidence | ||
| WED | 05:00 | JPY | Coincident Index (AUG F) (AUG F) | ||
| WED | 05:00 | JPY | Leading Index (AUG F) (AUG F) | ||
| WED | 08:30 | GBP | Bank of England Minutes (OCT 20) | ||
| WED | 18:00 | USD | Fed's Beige Book (OCT 20) | ||
| WED | 02:00 | CNY | Real GDP YoY (3Q) | 9.5% | 10.3% |
| WED | 02:00 | NZD | Consumer Confidence Index (OCT) | 116.4 | |
| WED | 02:00 | CNY | Producer Price Index (YoY) (SEP) | 4.1% | 4.3% |
| WED | 02:00 | CNY | GDP Year-to-Date (YoY) (3Q) | 10.5% | 11.1% |
| WED | 02:00 | CNY | Purchasing Price Index (YoY) (SEP) | 7.5% | |
| WED | 02:00 | CNY | Consumer Price Index (YoY) (SEP) | 3.6% | 3.5% |
| WED | 02:00 | CNY | Retail Sales (YoY) (SEP) | 18.5% | 18.4% |
| WED | 02:00 | CNY | Retail Sales YTD YoY (SEP) | 18.3% | 18.2% |
| WED | 02:00 | CNY | Industrial Production (YoY) (SEP) | 14% | 13.9% |
| WED | 02:00 | CNY | Industrial Production YTD YoY (SEP) | 16.3% | 16.6% |
| WED | 02:00 | CNY | Fixed Assets Inv Urban YTD YoY (SEP) | 24.6% | 24.8% |
| THU | 04:30 | JPY | All Industry Activity Index (MoM) (AUG) | -0.4% | 1.00% |
| THU | 06:15 | CHF | Trade Balance (Swiss franc) (SEP) | 1.20B | 0.58B |
| THU | 08:30 | GBP | Retail Sales (YoY) (SEP) | 2.0% | 1.9% |
| THU | 08:30 | GBP | Retail Sales with Auto Fuel (YoY) (SEP) | 0.9% | 0.4% |
| THU | 12:30 | USD | Initial Jobless Claims (OCT 16) | 453K | 462K |
| THU | 12:30 | USD | Continuing Claims (OCT 9) | 4420K | 4399K |
| THU | 14:00 | EUR | Euro-Zone Consumer Confidence (OCT A) | -11 | -11 |
| THU | G-20 Finance Ministers, C.Bank Governors | ||||
| FRI | CAD | Consumer Price Index (MoM) (SEP) | 0.1% | -0.1% | |
| FRI | CAD | Consumer Price Index (YoY) (SEP) | 1.9% | 1.7% | |
| FRI | CAD | Bank Canada CPI Core (MoM) (SEP) | 0.3% | 0.1% | |
| FRI | CAD | Bank Canada CPI Core (YoY) (SEP) | 1.6% | 1.6% |
As noted the main even this week is the China data; China's Q3 GDP will be closely watched and is forecast to come in around 9.5% (down slightly on previous 10.3%). The other bits to watch will be the CPI figures (expected to rise to 3.6%), as latent inflationary pressures are surely likely to flow through soon. Then of course there's also industrial production, retail sales, and fixed asset investment.
In monetary policy, the Bank of Canada is set to review monetary policy this week, with the consensus for a hold at 1.00%. The Reserve Bank of Australia and the Bank of England will release their latest monetary policy meeting minutes, and the US Federal Reserve will release its Beige Book report on the economy - something that will likely be read with much interest in the backdrop of speculation around a second round of quantitative easing.
On the topic of central banking there will be a high level summit of central bankers hosted by the IMF and the Peoples Bank of China in Shanghai on Monday (with a focus on macroprudential policies). Then there's the G-20 summit of finance ministers and central bank governors on Thursday, which will be a key forum as policy makers try to ensure a continuation of the economic recovery - without falling into the trap of a race to the bottom with currency wars and protectionism.
Other key features of the week will be CPI figures from Canada (expected to be about 1.9% y/y) and New Zealand (expected to be about 1.5% y/y). Also in the US there's industrial production and capacity utilisation figures on Monday; and housing starts, permits, and ABC consumer confidence on Tuesday.
So as always, have a great week, watch out for surprises, and stay tuned for updates...
Sources
DailyFX www.dailyfx.com/calendar
Forex Pros www.forexpros.com/economic-calendar/
Forex Factory www.forexfactory.com/calendar.php
Bloomberg www.bloomberg.com
+various statistics websites and central bank websites for verification
Article Source: http://www.econgrapher.com/17oct-calendar.html
Friday, July 9, 2010
Top 5 Graphs of the week - 10 July 2010
This week we look at the languishing US consumer credit figures, and the slowing non-manufacturing PMI, then examine the continued string of strong jobs growth in Australia, followed by a wrap-up of some of the key monetary policy decisions this week, and a review of the IMF World Economic Outlook update.
1. US Consumer Credit
Unsurprisingly, given the way much of the US data is pointing lately, the consumer credit figures dropped-off further in May, as deleveraging continued and consumer appetites for new lending remained cool. Consumer credit fell -$9.1 billion in May, vs expected -$2.0 billion, and a revised (down from positive $1 billion) -$14.9 billion. But in some ways a negative is a positive, sure in the short term it's not great, but it's a process that needs to continue, the US consumer needs to continue recovering; pay down debt after excessive borrowing, re-build balance sheets, and generally live within their means (which will be made even more difficult by potentially more constrained means in which to live!).

2. US Non-manufacturing PMI
Sticking with the theme of growing pessimism in the US (have you noticed all the articles being churned out on the next depression, the double dip, etc etc?) - whether it is warranted or not... The ISM non-manufacturing PMI or NMI, disappointed as well; falling to 53.9 from 55.4 (consensus 55). The employment sub-index fell back below 50 to 49.7, new orders slipped again to 54.4, and prices (similar to the manufacturing index) fell -6.8 to 53.8 - signaling a potential mismatch between supply and demand, and pointing to further slowing of inflation in the short term. The first half of this year has been easy for the US, the second half will be a little bit more difficult, and it's likely the W-shaped recovery will start seem more and more likely. But as noted in the previous chart; this has to be a structural recovery - not a cyclical one, and it's going to be hard.

3. Australian employment
Australia saw further jobs growth in June, adding 45.9k jobs vs an expected 15k, and building on the 22.8 added in May. This brings the total to 185k YTD, and 105k for the June quarter (-22.8k in Q2 2009). So overall a good outcome for the Australian economy, the strong labour market will likely underpin the economy as some of the stimulus measures start to run out (e.g. monetary policy tightening). It will also increase the case for further hikes of the interest rate as employment growth sees increasing rates of capacity utilisation. But as noted by the RBA in its recent monetary policy announcement, the Australian economy is basically fine at the moment - it's the global economy that will make or break the recovery from here.

4. Monetary Policy review
The week saw a few non-events on the monetary policy front with the BOE (Bank of England), ECB (European Central Bank), and RBA (Reserve Bank of Australia) holding each of their respective policy rates steady - as expected. But there was a couple of interesting moves in Asia; BNM (Bank Negara Malaysia) increased rates 25bps again to 2.75% as growth continued to surge. Likewise the BOK (Bank of Korea) increased rates for the first time in in 2 years, lifting the rate 25bps to 2.25%, having held at 2% for about 17 months. The actions are consistent with the view of a 3-tiered economic recovery; the fast growing emerging markets, the selected developed economies, and the languishing advanced economies.

5. IMF World Economic Outlook
Another key update out this week was the IMF's periodic update to its World Economic Outlook. The IMF updated its global growth forecasts, projecting the global economy to growth 4.5% in 2010, and 4.25% in 2011; representing an increase of about 0.50% in 2010 - reflecting stronger activity in the first half of the year. They rightly pointed out however that risks to the recovery "have risen sharply amid renewed financial turbulence", and that one of the key risks to the economic recovery - and to a more sustainable recovery is policy reform; the growth forecasts "hinge on implementation of policies to rebuild confidence and stability".

Summary
To provide a brief summary; US consumer confidence disappointed in May, adding to a string of disappointing US data, and adding to the case of further slowing. The non-manufacturing PMI did nothing to improve the outlook. And as noted the US economic recovery will need to be structural (because there just isn't the capacity for a cyclical recovery at the moment), so there will be a recovery - but it's going to be hard.
Meanwhile, Australia is cruising along (one of the tier-2 economies), adding jobs left right and center, and possibly adding to the case for a further increase or two of the interest rate. But as the RBA noted, while the economic recovery in Australia is relatively entrenched, it is very much exposed to the course of the global economy.
On the monetary policy front, the developed economies held as expected, but the faster growing Asian economies hiked rates, as the risks shifted to containing inflation over stimulating growth. And on that note, the IMF slightly lifted its global growth forecasts for 2010 in its update to the world economic outlook, but noted significant risks to the recovery.
Sources
1. US Federal Reserve www.federalreserve.gov
2. US Institute for Supply Management www.ism.ws
3. Australian Bureau of Statistics www.abs.gov.au
4. Bank of England www.bankofengland.co.uk ECB www.ecb.int Reserve Bank of Australia www.rba.gov.au Bank Negara Malaysia www.bnm.gov.my Bank of Korea www.bok.or.kr
5. International Monetary Fund www.imf.org
Article Source: http://www.econgrapher.com/top5graphs10jul.html
1. US Consumer Credit
Unsurprisingly, given the way much of the US data is pointing lately, the consumer credit figures dropped-off further in May, as deleveraging continued and consumer appetites for new lending remained cool. Consumer credit fell -$9.1 billion in May, vs expected -$2.0 billion, and a revised (down from positive $1 billion) -$14.9 billion. But in some ways a negative is a positive, sure in the short term it's not great, but it's a process that needs to continue, the US consumer needs to continue recovering; pay down debt after excessive borrowing, re-build balance sheets, and generally live within their means (which will be made even more difficult by potentially more constrained means in which to live!).

2. US Non-manufacturing PMI
Sticking with the theme of growing pessimism in the US (have you noticed all the articles being churned out on the next depression, the double dip, etc etc?) - whether it is warranted or not... The ISM non-manufacturing PMI or NMI, disappointed as well; falling to 53.9 from 55.4 (consensus 55). The employment sub-index fell back below 50 to 49.7, new orders slipped again to 54.4, and prices (similar to the manufacturing index) fell -6.8 to 53.8 - signaling a potential mismatch between supply and demand, and pointing to further slowing of inflation in the short term. The first half of this year has been easy for the US, the second half will be a little bit more difficult, and it's likely the W-shaped recovery will start seem more and more likely. But as noted in the previous chart; this has to be a structural recovery - not a cyclical one, and it's going to be hard.

3. Australian employment
Australia saw further jobs growth in June, adding 45.9k jobs vs an expected 15k, and building on the 22.8 added in May. This brings the total to 185k YTD, and 105k for the June quarter (-22.8k in Q2 2009). So overall a good outcome for the Australian economy, the strong labour market will likely underpin the economy as some of the stimulus measures start to run out (e.g. monetary policy tightening). It will also increase the case for further hikes of the interest rate as employment growth sees increasing rates of capacity utilisation. But as noted by the RBA in its recent monetary policy announcement, the Australian economy is basically fine at the moment - it's the global economy that will make or break the recovery from here.

4. Monetary Policy review
The week saw a few non-events on the monetary policy front with the BOE (Bank of England), ECB (European Central Bank), and RBA (Reserve Bank of Australia) holding each of their respective policy rates steady - as expected. But there was a couple of interesting moves in Asia; BNM (Bank Negara Malaysia) increased rates 25bps again to 2.75% as growth continued to surge. Likewise the BOK (Bank of Korea) increased rates for the first time in in 2 years, lifting the rate 25bps to 2.25%, having held at 2% for about 17 months. The actions are consistent with the view of a 3-tiered economic recovery; the fast growing emerging markets, the selected developed economies, and the languishing advanced economies.

5. IMF World Economic Outlook
Another key update out this week was the IMF's periodic update to its World Economic Outlook. The IMF updated its global growth forecasts, projecting the global economy to growth 4.5% in 2010, and 4.25% in 2011; representing an increase of about 0.50% in 2010 - reflecting stronger activity in the first half of the year. They rightly pointed out however that risks to the recovery "have risen sharply amid renewed financial turbulence", and that one of the key risks to the economic recovery - and to a more sustainable recovery is policy reform; the growth forecasts "hinge on implementation of policies to rebuild confidence and stability".

Summary
To provide a brief summary; US consumer confidence disappointed in May, adding to a string of disappointing US data, and adding to the case of further slowing. The non-manufacturing PMI did nothing to improve the outlook. And as noted the US economic recovery will need to be structural (because there just isn't the capacity for a cyclical recovery at the moment), so there will be a recovery - but it's going to be hard.
Meanwhile, Australia is cruising along (one of the tier-2 economies), adding jobs left right and center, and possibly adding to the case for a further increase or two of the interest rate. But as the RBA noted, while the economic recovery in Australia is relatively entrenched, it is very much exposed to the course of the global economy.
On the monetary policy front, the developed economies held as expected, but the faster growing Asian economies hiked rates, as the risks shifted to containing inflation over stimulating growth. And on that note, the IMF slightly lifted its global growth forecasts for 2010 in its update to the world economic outlook, but noted significant risks to the recovery.
Sources
1. US Federal Reserve www.federalreserve.gov
2. US Institute for Supply Management www.ism.ws
3. Australian Bureau of Statistics www.abs.gov.au
4. Bank of England www.bankofengland.co.uk ECB www.ecb.int Reserve Bank of Australia www.rba.gov.au Bank Negara Malaysia www.bnm.gov.my Bank of Korea www.bok.or.kr
5. International Monetary Fund www.imf.org
Article Source: http://www.econgrapher.com/top5graphs10jul.html
Wednesday, April 21, 2010
IMF: Recovery Is Stronger than Expected, but Speed Varies
The IMF just released its April 2010 World Economic Outlook; upgrading world output growth projections for 2010 to 4.2% and 4.3% for 2011 (up by about 1% since the 2009 report). The split shows emerging markets very much as the drivers of global growth with forecasts for 6.3% in 2010 and 6.5% in 2011; while the comparable figures for Advanced economies are 2.3% and 2.4% respectively:

The IMF noted the great rebound in activity indicators; notably in accelerating world trade (a critical aspect for a sustainable recovery - but a risk area as protectionism rhetoric grows). The IMF has picked world trade to grow at 7% in 2010 and 6.1% in 2011 (having contracted -10.7% in 2009):

The IMF is reasonably relaxed about inflationary pressures, noting that it sees low levels of capacity utilisation, and well-anchored inflation expectations. That said the IMF view was that inflation in developed economies did not drop-off as drastically as growth did. It also pointed to higher inflation risks in emerging economies (6.2% in 2010 vs 1.5% for advanced economies):

The IMF also cited repeatedly throughout the report that high unemployment remains a significant risk to a recovery in global demand, and broader economic growth, and noted it expected unemployment (which it also noted could actually be worse than expected) to remain high in advanced economies:

Thus the overall message is that the recovery is indeed underway, albeit uneven. However "activity remains dependent on highly accommodative macroeconomic policies and is subject to downside risks, as room for countercyclical policy maneuvers has sharply diminished and fiscal fragilities have come to the fore." Thus the same challenges remain in macroeconomic policy exit strategies (not least of all sustaining the recovery), and the example of Greece shows on the fiscal front that a clear and credible plan for fiscal sustainability is not just 'nice', but necessary.
Sources:
Econ Grapher Analytics www.econgrapher.com
International Monetary Fund www.imf.org
Article source: http://www.econgrapher.com/april2010-imfweo.html
"The global recovery has evolved better than expected, but in many economies the strength of the rebound has been moderate given the severity of the recession."

The IMF noted the great rebound in activity indicators; notably in accelerating world trade (a critical aspect for a sustainable recovery - but a risk area as protectionism rhetoric grows). The IMF has picked world trade to grow at 7% in 2010 and 6.1% in 2011 (having contracted -10.7% in 2009):
"Global activity has rebounded, as evidenced by accelerating world trade, industrial production, and retail sales. Employment continues to contract in advanced economies but is expanding again in emerging economies, helped by strong potential growth. Industrial confidence has returned to precrisis levels, but household confidence in advanced economies continues to lag, reflecting subdued employment."

The IMF is reasonably relaxed about inflationary pressures, noting that it sees low levels of capacity utilisation, and well-anchored inflation expectations. That said the IMF view was that inflation in developed economies did not drop-off as drastically as growth did. It also pointed to higher inflation risks in emerging economies (6.2% in 2010 vs 1.5% for advanced economies):
"Inflation pressures are projected to remain low, held down by high unemployment rates and excess capacity. Inflation has been higher and more volatile in emerging economies, and inflation pressures could resurface more easily there than in advanced economies."

The IMF also cited repeatedly throughout the report that high unemployment remains a significant risk to a recovery in global demand, and broader economic growth, and noted it expected unemployment (which it also noted could actually be worse than expected) to remain high in advanced economies:
"High unemployment poses major social problems. In advanced economies, unemployment is projected to stay close to 8.5% through 2011 and then to decline only slowly. Moreover, the problem is even larger than the statistics suggest. Many of the employed are working shortened hours or in temporary jobs with few benefi ts. Others would like to find work but have given up searching and are thus no longer recorded as unemployed in the statistics. There is no single measure for broader unemployment or underemployment, but available data suggest that it can often be higher by 25-50% than headline unemployment rates."

Thus the overall message is that the recovery is indeed underway, albeit uneven. However "activity remains dependent on highly accommodative macroeconomic policies and is subject to downside risks, as room for countercyclical policy maneuvers has sharply diminished and fiscal fragilities have come to the fore." Thus the same challenges remain in macroeconomic policy exit strategies (not least of all sustaining the recovery), and the example of Greece shows on the fiscal front that a clear and credible plan for fiscal sustainability is not just 'nice', but necessary.
Sources:
Econ Grapher Analytics www.econgrapher.com
International Monetary Fund www.imf.org
Article source: http://www.econgrapher.com/april2010-imfweo.html
Sunday, April 18, 2010
Econ Grapher - Economic Calendar - 19 April 2010
Here's the Economic Calendar for the week commencing 19 April 2010. The key data out this week is UK GDP, New Zealand CPI, Bank of Canada Monetary Policy decision, EU consumer confidence, and US home sales data and durable goods orders. But also on the radar this week is the April 2010 IMF World Economic Outlook (and the IMF Global Financial Stability report, due out the day before) which is always a tremendous resource for global economic analysis (the 3rd and 4th analytical chapters are already up here and look at unemployment dynamics during recessions and recoveries, and transitioning out of sustained current account surpluses). Also in the IMF sphere are the G20 and IMF/World Bank meetings on Friday and Saturday this week.
(More commentary follows the table)
| Day | Time (GMT) | Code | Event/Release | Forecast | Previous |
| MON | 22:45 | NZD | Consumer Price Index | 2.3% | 2.0% |
| MON | 5:00 | JPY | Consumer Confidence | 40 | |
| TUE | 13:00 | CAD | Bank of Canada i-rate decision | 0.3% | 0.3% |
| TUE | 8:30 | GBP | Consumer Price Index | 3.2% | 3.0% |
| TUE | 1:30 | AUD | RBA Meeting Minutes | ||
| WED | 8:30 | GBP | Jobless Claims Change | -32.3K | |
| WED | 8:30 | GBP | BoE Meeting Minutes | ||
| WED | 23:50 | JPY | Merchandise Trade Balance | 975.4B | 649.6B |
| WED | IMF World Economic Outlook | ||||
| THU | 8:00 | EUR | Euro-Zone Government Debt-GDP | 69.3% | |
| THU | 12:30 | USD | Producer Price Index | 6.1% | 4.4% |
| THU | 14:00 | USD | Existing Home Sales | 5.6% | -0.6% |
| THU | 14:00 | EUR | Euro-Zone Consumer Confidence | (17) | (17) |
| FRI | 8:30 | GBP | Gross Dometic Product Q1 | 0.4% | 0.4% |
| FRI | 12:30 | CAD | Retail Sales | 0.0% | 0.7% |
| FRI | 8:00 | EUR | German IFO Business Climate | 98.7 | 98.1 |
| FRI | 11:00 | CAD | Consumer Price Index | 1.6% | 1.6% |
| FRI | 12:30 | USD | Durable Goods Orders | 0.1% | 0.9% |
| FRI | 14:00 | USD | New Home Sales | 4.6% | -2.2% |
| FRI | IMF and G20 Meetings |
In some ways the IMF (and G20 meetings) will dominate the headlines this week. The World Economic Outlook will as mentioned be a great resource, and it will be interesting to see what the IMF forecasts for the global economy over the next couple of years. In terms of the meetings exit strategies, trade, global imbalances, financial system reform, tax evasion, and banking regulation. No doubt the EU and US will pull the yuan issue into the meetings too. So while these are usually talk-fests it will be worth reviewing the post-meeting communiqué for anything interesting.
On the economic data front the main even will be UK GDP, some are forecasting year over year growth to approach the zero mark with a second quarter of 0.4% growth. There's also the consumer price index measure of inflation from Canada, UK, and New Zealand - the US also has the producer price index out. All forecasts are for a pick up in inflation, but only marginally; though inflationary pressure is broadly likely to resurface later in the year.
There's also monetary policy decision meeting minutes released by the Bank of England and the Reserve Bank of Australia. The BoE report will be somewhat ho-hum, but the RBA report will be well worth a read as the bank brings monetary policy back to neutral. Some RBA officials have noted that the rate is approaching neutral levels after five 25 basis point hikes to 4.25% off the record low emergency settings. Also in monetary policy is the Bank of Canada's interest rate decision; the bank has previously noted it would wait until at least Q2 before raising the rate, it may not be this time, but Canada could be next in line for some tightening.
Stay tuned for updates...
Sources
DailyFX www.dailyfx.com/calendar
Forex Pros www.forexpros.com/economic-calendar/
Forex Factory www.forexfactory.com/calendar.php
Bloomberg www.bloomberg.com
+various statistics websites and central bank websites for verification
Article Source: http://www.econgrapher.com/19apr-calendar.html
Wednesday, January 27, 2010
IMF Revises Global Growth Forecasts Up
The IMF released its update to the World Economic Outlook - a respected, useful and comprehensive report on the progress and prospects of the global economy. This article provides a brief analysis of some of the key points of the update in the usual Econ Grapher fashion.
Before looking at the charts, it's worth noting the title "a policy-driven, multispeed recovery". This is an adroit description of how things are unfolding. For example, emerging markets versus developed economies; and within developed economies there's even different paces e.g. UK (slow, and subdued) vs Australia (relatively unscathed, and recovering faster).
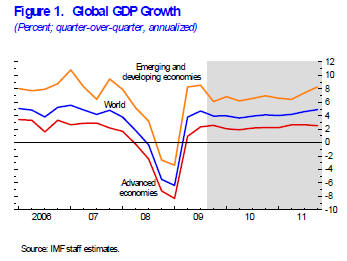
1. Global GDP Growth
The first chart in the report is the old global growth outlook chart. On GDP growth, the IMF revised it's forecast for the global economy to 3.9% in 2010, vs a previously forecast 3.1%. There really isn't anything surprising about it for those who've been paying attention.
The advanced economies took the biggest hit, and will return to growth eventually, albeit potentially lower then the average prior to the crisis. Then there's the emerging markets who did take a hit to a greater or lesser extent, but are set to recover back to high growth levels.
"In most advanced economies, the recovery is expected to remain sluggish by past standards, whereas in many emerging and developing economies, activity is expected to be relatively vigorous, largely driven by buoyant internal demand."

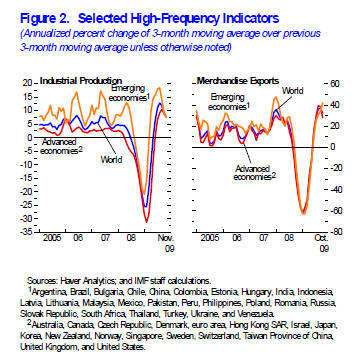
2. High-Frequency Indicators
The next chart to look at from the report is the high-frequency indicators: industrial production, and merchandise exports. Global trade is a great metric to monitor for gauging the level of economic activity in the world economy.
On trade, many countries have seen a recovery in trader off the lows or a "normalisation", indeed China has already reached the same levels it saw just prior to the crisis. Meanwhile industrial production, for now is underpinned by stimulus measures and the inventory cycle.
"In advanced economies, the beginning of a turn in the inventory cycle and the unexpected strength in U.S. consumption contributed to positive developments. Final domestic demand was very strong in key emerging and developing economies, although the turn in the inventory cycle and the normalization of global trade also played an important role."

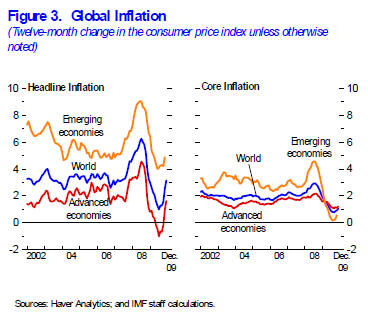
3. Global Inflation
For those that follow the Econ Grapher updates, it's no surprise to see the trends in inflation in the charts below. There has been a marked turnaround in headline inflation, boosted in part by a low comparison value, and similarly by the commodities cycle. What's also interesting to note though is that core inflation has also bottomed out and started to turn upwards.
The inflation piece of the puzzle is an interesting one, and while some (e.g. PIMCO) are suggesting deflation, others are warning about inflation. This plays into how monetary and fiscal policy will evolve over the next year, and it will be a difficult dilemma for policy makers to find the middle path.
"In the advanced economies, headline inflation is expected to pick up from zero in 2009 to 1¼ percent in 2010, as rebounding energy prices more than offset slowing labor costs. In emerging and developing economies, inflation is expected to edge up to 6¼ percent in 2010, as some of these economies may face growing upward pressures due to more limited economic slack and increased capital flows."

Before summing up it's worth reviewing what the IMF sees as the key Upside, and Downside risks.
Upside:
-"The reversal of the confidence crisis and the reduction in uncertainty may continue to foster a stronger-than-expected improvement in financial market sentiment and prompt a larger-than-expected rebound in capital flows, trade, and private demand."
-"New policy initiatives in the United States to reduce unemployment could provide a further impetus to both U.S. and global growth."
Downside:
-"A premature and incoherent exit from supportive policies may undermine global growth and its rebalancing."
-"Impaired financial systems and housing markets or rising unemployment in key advanced economies may hold back the recovery in household spending more than expected."
-"Rising concerns about worsening budgetary positions and fiscal sustainability could unsettle financial markets and stifle the recovery by raising the cost of borrowing for households and companies."
-"Rallying commodity prices may constrain the recovery in advanced economies."
Summary
The update to the World Economic Outlook has provided some interesting data and projections, as well as thoughts to consider. The upward revisions to the growth outlook are promising in terms of where 2010 may go, but it's clear by looking at the balance of risks, that there is still much more that can go wrong than right at this point.
In terms of how this ties in with investment strategy, it confirms a reasonably widely held view that emerging markets will outperform developed markets in the coming years (at least on an economic growth basis). It also adds to the macro risk-reward picture over the next couple of years in terms of how the recovery will evolve, and what may derail it (and therefore what to keep an eye out for).
Source:
1, 2, 3. IMF World Economic Outlook (WEO) Update http://www.imf.org/external/pubs/ft/weo/2010/update/01/index.htm
Article Source: http://econgrapher.site1.net.nz/WEOupdate-jan2010.html
Before looking at the charts, it's worth noting the title "a policy-driven, multispeed recovery". This is an adroit description of how things are unfolding. For example, emerging markets versus developed economies; and within developed economies there's even different paces e.g. UK (slow, and subdued) vs Australia (relatively unscathed, and recovering faster).
1. Global GDP Growth
The first chart in the report is the old global growth outlook chart. On GDP growth, the IMF revised it's forecast for the global economy to 3.9% in 2010, vs a previously forecast 3.1%. There really isn't anything surprising about it for those who've been paying attention.
The advanced economies took the biggest hit, and will return to growth eventually, albeit potentially lower then the average prior to the crisis. Then there's the emerging markets who did take a hit to a greater or lesser extent, but are set to recover back to high growth levels.
"In most advanced economies, the recovery is expected to remain sluggish by past standards, whereas in many emerging and developing economies, activity is expected to be relatively vigorous, largely driven by buoyant internal demand."
2. High-Frequency Indicators
The next chart to look at from the report is the high-frequency indicators: industrial production, and merchandise exports. Global trade is a great metric to monitor for gauging the level of economic activity in the world economy.
On trade, many countries have seen a recovery in trader off the lows or a "normalisation", indeed China has already reached the same levels it saw just prior to the crisis. Meanwhile industrial production, for now is underpinned by stimulus measures and the inventory cycle.
"In advanced economies, the beginning of a turn in the inventory cycle and the unexpected strength in U.S. consumption contributed to positive developments. Final domestic demand was very strong in key emerging and developing economies, although the turn in the inventory cycle and the normalization of global trade also played an important role."
3. Global Inflation
For those that follow the Econ Grapher updates, it's no surprise to see the trends in inflation in the charts below. There has been a marked turnaround in headline inflation, boosted in part by a low comparison value, and similarly by the commodities cycle. What's also interesting to note though is that core inflation has also bottomed out and started to turn upwards.
The inflation piece of the puzzle is an interesting one, and while some (e.g. PIMCO) are suggesting deflation, others are warning about inflation. This plays into how monetary and fiscal policy will evolve over the next year, and it will be a difficult dilemma for policy makers to find the middle path.
"In the advanced economies, headline inflation is expected to pick up from zero in 2009 to 1¼ percent in 2010, as rebounding energy prices more than offset slowing labor costs. In emerging and developing economies, inflation is expected to edge up to 6¼ percent in 2010, as some of these economies may face growing upward pressures due to more limited economic slack and increased capital flows."
Before summing up it's worth reviewing what the IMF sees as the key Upside, and Downside risks.
Upside:
-"The reversal of the confidence crisis and the reduction in uncertainty may continue to foster a stronger-than-expected improvement in financial market sentiment and prompt a larger-than-expected rebound in capital flows, trade, and private demand."
-"New policy initiatives in the United States to reduce unemployment could provide a further impetus to both U.S. and global growth."
Downside:
-"A premature and incoherent exit from supportive policies may undermine global growth and its rebalancing."
-"Impaired financial systems and housing markets or rising unemployment in key advanced economies may hold back the recovery in household spending more than expected."
-"Rising concerns about worsening budgetary positions and fiscal sustainability could unsettle financial markets and stifle the recovery by raising the cost of borrowing for households and companies."
-"Rallying commodity prices may constrain the recovery in advanced economies."
Summary
The update to the World Economic Outlook has provided some interesting data and projections, as well as thoughts to consider. The upward revisions to the growth outlook are promising in terms of where 2010 may go, but it's clear by looking at the balance of risks, that there is still much more that can go wrong than right at this point.
In terms of how this ties in with investment strategy, it confirms a reasonably widely held view that emerging markets will outperform developed markets in the coming years (at least on an economic growth basis). It also adds to the macro risk-reward picture over the next couple of years in terms of how the recovery will evolve, and what may derail it (and therefore what to keep an eye out for).
Source:
1, 2, 3. IMF World Economic Outlook (WEO) Update http://www.imf.org/external/pubs/ft/weo/2010/update/01/index.htm
Article Source: http://econgrapher.site1.net.nz/WEOupdate-jan2010.html
Subscribe to:
Posts (Atom)


