Just a quick update on the Chinese property market. I tend to keep one eye on the Soufun 100-city index, and the other eye on the NBS 70-city data. Of course it is somewhat fraught to look at an aggregated-up index over such a vast and diverse country, but the trend is still very important for macro analysis of China given the strong link of fixed asset investment, government revenue, private wealth, and of course the banking and finance sector to real estate prices and activity.
So in this update I'll show you the Soufun graphs with the September data, and pop in a few other relevant bits and pieces I've happened upon.
First Glance: I have been expecting a gradual turnaround in real estate prices; and slower gains are now looking to be turning into small losses. A key question, and a key risk area for China, will be the extent to which the property market slows. A route in prices wont be the end of China but it will mark a temporary end to its post-bubble-government-reflation-bubble.
So, onto the Soufun (maybe not 'so-fun'?) data. In September prices fell a whopping -0.03% to an average 8,877 yuan per square meter. The current level is 313 yuan higher than the start of the year, and up about 6.1% from the same time last year.

Prices rose in 54 out of 100 cities, and fell in 44 cities (2 unch). The last point is noticeable - the graph below charts the no. of cities which recorded rising prices, and yes, that does look like a trend.

So, the Soufun data so looks like the start of a trend, but of course we'll need to see another couple of months before we can rule out fluctuations. Also the NBS data will be out - usually around the 18/19th of the month, so it will be good to check that dataset for confirmation.
Now, onto another couple of charts I found in a China Daily article. The data in the charts are for 1-18 Sep in the relevant years. Key points: volume has tanked compared to levels seen during the the pre-2008 bubble, and the post-2008 reflation bubble. Prices have doubled over 5 years (but then incomes have also doubled over the past 5 years).
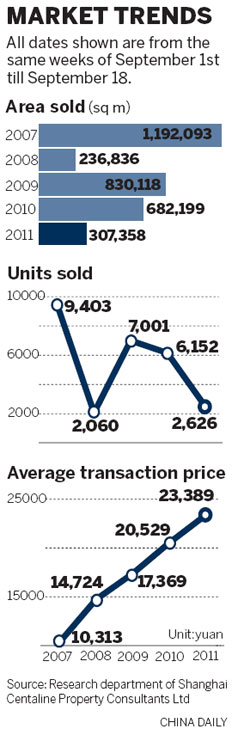
If you saw a stock chart with a surging price, and with volume which trailed off to low levels, what would you think? The answer has to be that the market is getting a bit fatigued at the current price level. But having said that, I still think there are fundamental forces which should logically support higher prices (e.g. urbanization, rising incomes, the culture part of needing to own a house, demand for property as a store of value/inflation hedge, etc).
The dual forces of price exhaustion and government policy aimed at improving house price affordability, will likely continue to weigh on property prices in the near term though. I struggle to see a catastrophic unwinding, rather a period of price dullness; with the market naturally taking a breather, and the government breathing down the neck of developers and bankers.
To me it seems there is enough fundamental strength to support a baseline demand and price level for property in China. But like many, I am paying a lot of attention to the "landing" of China, and whether it be soft, hard or something in between. In any case the market will be pricing (or overpricing) any further signs of a harder landing, or more relevantly - the likelihood of the formation of perfect storms; and that is a non-zero probability risk.
Proceed with caution (and optimism).
Econ Grapher


No comments:
Post a Comment
What do you think?