Showing posts with label US GDP. Show all posts

Friday, March 25, 2011

Top 5 Economics Graphs of the Week - 26 Mar 2011

This week we take a look at the December quarter economic growth statistics coming out of three very different developed economies. First up is US, with strongest growth of the three, then France, and New Zealand. We also take a look at the rising UK inflation figures and think about what they mean for the Bank of England. Finally we review some emerging market monetary policy tightening moves over the past week, which point to growing opportunities and risks for emerging market equities.

1. US GDP
The US saw 4th quarter 2010 GDP revised up, with the final reading showing the US economy rose 3.1% on a seasonally adjusted annualized rate in Q4. The reading compares with 2.8% in the previously released result, and is up from Q3's 2.6%. The upward revision reflected stronger inventories, non residential building investment, equipment and software investment, and even residential investment. The results reflect the theme of a manufacturing lead recovery, with business starting to become more confident in investing in their business, and gradually rising internal and external demand. The US economy is likely to gain momentum through 2011, with corporate earnings likely to also gain momentum as analyst forecasts for S&P 500 earnings point to growth as great as 15% year on year in H2 2011. However there are due downside risks, such as the state of the global economy, and the US fiscal situation.

2. France GDP
France reported GDP growth of 0.4% in Q4, revised up from 0.3% (with third quarter GDP being revised down to 0.2% from 0.3%), and placing GDP up 1.5% on an annual basis. The figure was boosted by a rise in household consumption expenditure, with final domestic demand making a positive contribution, and investment growth making a marginal contribution. Net exports also positively contributed as import demand slowed. Inventories had a net negative contribution. The Bank of France is forecasting economic growth to gain momentum this quarter, with growth expected to come in at around 0.8% in 1Q11. Also of interest was the French consumer confidence numbers, which showed consumers concern with inflation taking precedence over concerns with unemployment, confirming comments by the European Central Bank on the risks of second round inflation effects from rising commodity prices.
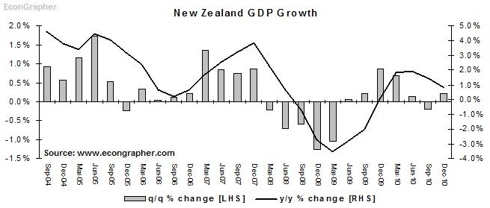
3. New Zealand GDP
The New Zealand economy grew 0.2% q/q in the December 2010 quarter (-0.2% 3Q10), placing it up 0.8% year on year (1.5% 3Q10). The strongest sectors on a quarterly basis were fishing, forestry and mining, manufacturing, construction, and personal and community services. While the worst performing sectors were wholesale trade, retail, accommodation and restaurants, and utilities. So it was basically the primary sectors doing well, with the consumer sector still struggling. Thus the results overall were hardly spectacular, but the outlook is more promising, with the earthquake rebuilding effort likely to start making positive contributions as early as H2 2011. In addition, the Rugby World Cup will also add tourism revenues and boost the consumer sector. High agricultural commodities will boost the primary exporting sector, particularly dairy. And loose monetary policy will also assist the economic recovery.

4. UK CPI
The United Kingdom fell prey to the global inflation trend, with its annual CPI inflation rate rise to 4.4% in February this year, beating expectations of 4.2%, and rising from 4.0% in January. The figure will no doubt irk the Bank of England, which is likely to come under increasing pressure to raise rates from excessively stimulatory levels (0.50%). Indeed, in its most recent meeting minutes the Bank of England noted it is likely that inflation will rise to as much as 5% or more, before normalizing, with the Bank expecting inflation to fall back to the official inflation target of 2% in 2012. Inflation in the UK is still being boosted by the one-off effect of sales tax rises, and the impact of strong commodity prices. While these are in theory one-off/temporary effects, there is still a risk that inflation expectations may rise. Provided the economic situation doesn't materially deteriorate it is likely the BoE will start normalizing monetary policy before long.

5. Monetary Policy
The week in monetary policy was characterized by further emerging market monetary policy tightening with the following central banks lifting policy rates: Nigeria +100bps to 7.50%, Kenya +25bps to 6.00%, Uruguay +100bps to 7.50%, and the Philippines +25bps to 4.25%. Meanwhile two Central Banks held their policy rates, but tightened reserve requirements; Turkey +300bps to 15%, and Russia +100bps to 5.5% (and +50bps to 4%). For emerging markets, monetary policy continues to be the wild card. If emerging markets are able to tackle the inflation challenge successfully without growth taking too much of a hit then emerging market equities are likely to bring in strong returns - especially coming off current modest/reasonable valuation levels. However the obvious flip side is the policy risk puzzle, with the possibility of hard landings coming from over-tightening.


Summary

So we saw the US revising its GDP growth numbers upward as the US economy gained momentum, with all signs pointing to a strong 2011 - but with due downside risks. France likewise upgraded its GDP numbers in Q4 2010, but with momentum rising, also showed signs of rising inflationary pressures. Meanwhile New Zealand reported a marginally positive but relatively weak Q4 GDP result, but with the conditions coming into place to support a strong 2011, particularly in the later half of the year. Over to the UK, British inflation rose further, adding increasing pressure on the Bank of England to start normalizing monetary policy. While emerging markets continued their monetary policy tightening campaign to rein in rising inflation on the back of commodity prices and strong economic growth.

Sources
1. US Bureau of Economic Analysis www.bea.gov
2. OECD Statistics Database stats.oecd.org
3. Statistics NZ www.stats.govt.nz
4. Trading Economics www.tradingeconomics.com
5. CentralBankNews.info www.centralbanknews.info

Article Source: http://www.econgrapher.com/top5graphs26mar11.html

Friday, November 26, 2010

Top 5 Economics Graphs of the Week - 27 November 2010

This week we review the Q3 GDP revisions from the US and UK, then we look at the October CPI data from Canada and Japan, before finishing with a summary of a selection of emerging market monetary policy decisions over the past week.

1. US Q3 GDP Revision
US Q3 GDP was revised up to a 2.5% seasonally adjusted annualised rate, from the previous estimate of 2.0%, this was ahead of expectations for 2.4%. Within the results final demand was revised up, and net exports made a smaller negative contribution. Year on year GDP is up 3.2% vs 3.0% in the September quarter. Overall the result is relatively strong, showing a continuation of the bounce back, and it could well gain momentum, but the more likely outcome is ups and downs over the next year.

2. UK Q3 GDP Revision
UK GDP expanded 0.8% from the June quarter, in line with previous data, and placing the UK economy ahead by 2.8% compared to 2009. In the detail the stronger sectors were construction, manufacturing, exports, and transport, storage and communication services. While the weaker sectors were mining and utilities. The UK economies continues to bumble along out of recession, but it is quite promising that exports are expanding, the test will be how the UK government can manage its budget and how monetary policy plays out from here.

3. Japan Consumer Price Index
Japan saw its first positive year on year inflation rate in October, with CPI increasing 0.2% year on year, vs -0.6% in September. But it can't really be said that deflation is done, as much of the increase in the CPI was related to an increase in tobacco taxes. But it will be a welcome result to the Bank of Japan, which has been trying and trying to stimulate the economy and start inflation going again, instead of the persistent and pernicious deflation.

4. Canada Consumer Price Index
Canada saw a bit of a jump in inflation in October, with the CPI increasing 2.4% year on year vs 1.9% in September. This has caused the market to anticipate further rate rises from the Bank of Canada, which last changed the key policy rate to 1.00% in September, as part of a gradual normalization of monetary policy. Canada in many ways has been relatively lucky in coming through the crisis, and is in some ways similar to Australia, with its rich natural resources.

5. Monetary Policy Review
The past week saw several emerging market economies review their monetary policy interest rate settings, including; Russia, Mexico, Georgia, Kenya, Poland, Nigeria, Angola, and Israel. The main standout was Angola, which slashed its benchmark rate -394 basis points to 18.00% as a new central bank governor took the helm. Nigeria and Israel also made adjustments to the spread between borrowing and lending around the main policy rate, as steps towards policy normalisation following the global recession. But basically the main theme was a lot of holding rates, with much of the justification being that rates were appropriate at current settings either due to inflation being contained or relatively high, and overall balancing the risks of growth and inflation.

Summary

So we saw GDP expanding in the US, and at a faster pace than expected, and with promising signs in the details. Meanwhile in the UK the results were also relatively positive. But for both nations the challenge for their economies will be to carry on the momentum of the initial bounce back - but in a sustainable manner.

On the inflation and monetary policy front, there were positive, but not fabulous results in Japan, as the first positive headline inflation figure came through in almost 2 years. While Canada saw an acceleration of inflation, and speculation of further rate hikes. On monetary policy, there was a few meetings over the week but very little action, as settings were seen appropriate in achieving the balance between growth risks and inflation risks.

Sources
1. US Bureau of Economic Analysis www.bea.gov
2. National Statistics Office www.statistics.gov.uk
3. Trading Economics www.tradingeconomics.com
4. Trading Economics www.tradingeconomics.com
5. Central Bank News www.centralbanknews.info

Article Source: http://www.econgrapher.com/top5graphs27nov.html

Friday, August 27, 2010

Top 5 Economics Graphs of the Week - 28 August 2010

This week we take a look at GDP stats from the robust German economy, and the less than robust US economy. Then we look closer at the US situation; reviewing the existing home sales data, and consumer sentiment data. We then wrap up with a review of the July trade figures from Japan.

1. German GDP
Germany proved itself to be one of the strongest developed economies (and certainly within the EU). Overall the German economy grew 2.2% compared to the previous quarter (the fastest growth rate since East and West Germany reunified). The surge in growth was driven by strong exports, up 8.2% in Q2; boosted by trade with China and the US... which should immediately raise some concerns given the slowing of those two economies. However equipment investment (up 4.4%) also grew relatively strongly; and consumer spending returned to growth (0.6%). So there are growing signs of fundamental strength in the German economy, as well as from the rebound in international trade.


2. US GDP
The US economy showed further signs of descending into the double dip as the second quarter GDP growth rate was downgraded to 1.6% annualised (0.4% q/q) vs initial reading of 2.4% annualised (0.6% q/q). The downgrade was driven by a higher net export deficit and smaller gain in inventories; as well as residential investment and government purchases; these were partially offset by slight upward adjustments to personal consumption and nonresidential fixed investment. From here the vulnerability and weight of risks is almost certainly weighted to the downside, there's a weakening housing market, a still high unemployment rate, a necessary period of deleveraging to go through; so the weight of probabilities is for a dip back into negative growth. The best case scenario would be for stagnant growth (the muddle ages).


3. US Existing Home Sales
US existing home sales confirmed concerns by many that the US housing market is still a major risk area for the US economic recovery. On a seasonally adjusted annualised basis existing home sales dropped to 3.83 million from 5.37 million in June (consensus was for a dip to just 4.65m). Supply at the current sales rate expanded from 8.9 months to 12.5 months - the worst reading in 11 years. For now prices have only dipped slightly, with reluctant sellers not yet giving in, the median price dipped to $182,600 from $183,700 in June. So, as noted above, unless something radical happens, the US housing market remains a critical threat to the US economic recovery.


4. US Consumer Sentiment
On a similar vein, the Reuters/University of Michigan Consumer Sentiment index crept along, rising slightly from the July reading (68.9 vs 67.8). Expectations improved less; 62.9 vs 62.3 and current conditions improved to 78.3 from 76.5. Overall the impact of scarce jobs and stagnating incomes have spurred consumers to hunker down; taking a more defensive outlook with the whole deleveraging and cash reserve building behaviour becoming more and more endemic (and for good reasons). The data lines up with the weak housing data, and slowing trend in the GDP data; unless the manufacturing sector really pulls a rabbit out of the hat; and exports somehow surge, the outlook keeps coming back to the scenario of a double dip.


5. Japan Trade
Japan saw a continuation of the recovery in exports (and imports), but at a slightly slower pace. Looking to the chart its clear the trend is showing a recovery, but still; exports are well below trend, and are still yet to return to levels seen prior to the crash in global trade. Exports climbed 23.5% year on year to 5.983 trillion yen ($71 billion), the year on year growth rate in June was 27.7%. Interestingly the key driver of growth was continued sales of cars and electronic components to emerging economies like China and other Asian countries; which is promising somewhat given their higher potential growth rates. But the Japanese Yen has been appreciating, and this could reduce export competitiveness. So for Japan, trade remains the key to sustaining economic growth, but the downside risks remain.


Summary

So we saw two key developed economies provide updates on their GDP situations. On the one hand there was Germany - albeit caught up still with some of the wider EU risks - which was showing surprising resilience, with strong exports, growth in investment, and even a return of consumer spending. The signs are for continued strength in the German economy.

The US however showed weakness on almost all fronts; and the housing data and consumer sentiment data did nothing to provide comfort. It's becoming increasingly harder to get to any other conclusion than for a double dip. The best case is likely to be a prolonged period of stagnant growth, aka the muddle ages of the recovery.

Over to Japan, the challenges of deflation (which increased to -1.1% in July), high government debt, and low consumer spending; were carried once again by strength in trade. But again, as some of its key trade partners show signs of slowing, and as the Yen appreciates, the outlook is probably also for relatively stagnant growth at best.

Sources
1. OECD Stats stats.oecd.org
2. Bureau of Economic Analysis www.bea.gov
3. Realtor.org www.realtor.org
4. Reuters/Univesity of Michigan customers.reuters.com
5. Japan External Trade Organization www.jetro.go.jp


Article Source: http://www.econgrapher.com/top5graphs28aug.html

Sunday, August 22, 2010

Economic Calendar - 23 August 2010

Here's the Economic Calendar for the week commencing the 23rd of August 2010. This week there's Q2 GDP results from 3 key developed economies; Germany, UK, and the US. On the US, there's also new home/existing home sales, the house price index, and both ABC and University of Michigan consumer sentiment indexes. Elsewhere, Japan will be releasing 3 key stats; exports, CPI, and employment figures. And of course another key feature of this week is the Jackson Hole Symposium at the end of the week; an exclusive monetary policy festival in the US.

(More commentary follows the table)

Day Time (GMT) Code Event/Release Forecast Previous
MON 08:00 EUR Euro-Zone PMI Services (AUG A) 55.5 55.8
MON 08:00 EUR Euro-Zone PMI Composite (AUG A) 56.4 56.7
MON 08:00
Euro-Zone PMI Manufacturing (AUG A) 56.4 56.7
MON 12:30 USD Chicago Fed National Activity Index (JUL)
-0.63
MON 14:00 EUR Euro-Zone Consumer Confidence (AUG A) -13 -14
MON 03:00 NZD RBNZ 2-Year Inflation Expectation (3Q)
2.8%
TUE 06:00 EUR German GDP s.a. (QoQ) (2Q F) 2.2%
TUE 06:00 EUR German GDP w.d.a. (YoY) (2Q F) 3.7% 1.6%
TUE 06:00 EUR German GDP n.s.a. (YoY) (2Q F) 4.1% 1.7%
TUE 06:00 EUR German Imports (2Q F)
6.1%
TUE 06:00 EUR German Exports (2Q F)
2.6%
TUE 09:00 EUR Euro-Zone Industrial New Orders s.a. (MoM) 1.5% 3.2%
TUE 09:00 EUR Euro-Zone Industrial New Orders (YoY) (JUN) 24.2% 22.9%
TUE 12:30 CAD Retail Sales (MoM) (JUN)
-0.2%
TUE 14:00 USD Existing Home Sales (JUL)
5.37M
TUE 14:00 USD Richmond Fed Manufacturing Index (AUG) 12 16
TUE 14:00 USD Existing Home Sales (MoM) (JUL)
-5.1%
TUE 21:00 USD ABC Consumer Confidence (JUL)

TUE 23:50 JPY Merchandise Trade Imports (YoY) (JUL) 19.8 26.1
TUE 23:50 JPY Merchandise Trade Exports (YoY) (JUL) 21.8 27.7
WED 12:30 USD Durable Goods Orders (JUL) 3.0% -1.0%
WED 12:30 USD Durables Ex Transportation (JUL) 0.5% -0.6%
WED 14:00 USD House Price Index (MoM) (JUN)
0.5%
WED 14:00 USD New Home Sales (JUL) 330K 330K
WED 14:00 USD New Home Sales (MoM) (JUL) 0.0% 23.6%
WED 14:00 USD House Price Purchase Index (QoQ) (2Q)
-1.9%
THU 12:30 USD Initial Jobless Claims (AUG 21) (AUG 21) 485K 500K
THU 23:30 JPY National Consumer Price Index (YoY) (JUL) -0.9% -0.7%
THU 23:30 JPY Jobless Rate (JUL) 5.3% 5.3%
THU 23:30 JPY Tokyo Consumer Price Index (YoY) (AUG) -1.1% -1.2%
THU 00:00 EUR German Consumer Price Index (YoY) (AUG P) 1.1% 1.2%
THU

Jackson Hole Symposium (Monetary Policy)

FRI 08:30 GBP Gross Domestic Product (QoQ) (2Q P) 1.1% 1.1%
FRI 08:30 GBP Gross Domestic Product (YoY) (2Q P) 1.6% 1.6%
FRI 12:30 USD Gross Domestic Product (Annualized) (2Q S) 1.4% 2.4%
FRI 12:30 USD Personal Consumption (2Q S) 1.7% 1.6%
FRI 12:30 USD Gross Domestic Product Price Index (2Q S) 1.8% 1.8%
FRI 12:30 USD Core Personal Consumption Expenditure (QoQ) 1.1% 1.1%
FRI 13:55 USD U. of Michigan Confidence (AUG F) 70.0 69.6
FRI

Jackson Hole Symposium (Monetary Policy)

So the main data releases dues out this week are some more Q2 GDP results from some pretty key developed economies. Up first is Germany, which is expected to show year on year growth of 3.7%, compared to 1.6%; as one of the EU's strongest economies recovers well due to its relatively stronger fiscal position and machine exports to China. The next up is the UK, which is expected to show similar results to that of Q1 this year as the British economy muddles along. Then there's the US; which is expected to show 1.4% compared to 2.4% last time; as the growth decelerates into the double dip or muddle ages of the recovery.

Another key set of data out this week is the stats due from Japan. First up is Japan's international trade stats with merchandise trade imports and exports for July; both are expected to show slightly lower growth on an annual basis; these stats will be critical to watch as the Japanese economy has shown itself to be particularly sensitive to international trade. The next set of data from Japan is the CPI data, which is forecast to show the deflation rate (usually we call it the inflation rate when we talk CPI, but Japan has been so mired in deflation...). The jobless rate is also due out and expected to come in around 5.3%

As for the other bits of data out this week the main other ones of interest are (in no particular order); starting in the EU, there's EU consumer confidence, expected to remain pretty sick, EU PMI; sideways like a crab, and industrial new orders; growing but slightly less than May. In the US; existing home sales, ABC consumer confidence, durable goods orders - expected to pick up, new home sales - flat to to sideways at best, and UoM consumer sentiment on Friday - with maybe a slight increase. The RBNZ in New Zealand will also issue it's 2-year inflation expectation figures - important to monitor in the context of monetary policy, interest rates, and the NZD.

And on the topic of monetary policy, the Jackson Hole Symposium kicks off on Thursday in the US, with a star-studded line-up of central bankers from all over the world; where a couple of days of intensive debate and discussion will take place on the state of the global economy and the course of monetary policy. So keep monitoring the media around those days for what might emerge, in case anything of interest arises. The talk will probably focus on exit strategies, and how to avoid double-dips, lost decades, deflations, depressions, despair, destitution, etc.

So as always, have a great week, watch out for surprises, and stay tuned for updates...

Sources
DailyFX www.dailyfx.com/calendar
Forex Pros www.forexpros.com/economic-calendar/
Forex Factory www.forexfactory.com/calendar.php
Bloomberg www.bloomberg.com
+various statistics websites and central bank websites for verification


Article Source: http://www.econgrapher.com/23aug-calendar.html

Friday, July 30, 2010

Top 5 Economics Graphs of the Week - 31 July 2010

This week we look at the GDP numbers for Q2 from the US and South Korea. Then we look at the US consumer confidence and Case Shiller housing market data, and finish up with a look at inflation and unemployment in Japan, and New Zealand monetary policy.

1. US GDP
The US economy grew 2.4% SAAR in the second quarter (0.6% in normal terms), slightly below consensus 2.5%, and slower than the revised 3.7% in Q1. On an annual basis GDP is up 3.2% vs 2.4% in Q1. The main drivers of growth were residential investment, investment in equipment & software, and inventories; the main detractor was (surprise, surprise) a shrinking of net exports. So overall not a bad result, but probably as good as it gets for now, especially given where much of the US data points are at, there are several indicators (as well as underlying fundamentals e.g. weak housing market) that will make the second half a lot harder. So rumors about the potential for more easing both on the fiscal and monetary policy fronts may end up validated in the second half of this year... watch this space.

2. South Korea GDP
The South Korean economy grew 1.5% in the second quarter, slower than the 2.1% recorded in Q1, but above consensus of 1.1%. On an annual basis GDP was up 7.2%, off slightly from 8.1% in Q1, but also above consensus 6.6%. The expansion was driven by strong export-led manufacturing activity and facility investment, but the construction sector was a detractor (driven by a sluggish domestic real estate market). The continued expansion will likely spur the Bank of Korea to raise interest rates again (having increased 25bps to 2.25% early this month). But like all trade driven economies, the Republic of Korea will be closely exposed to the fortunes of the global economy in the second half.

3. US Housing market and Consumer Confidence
US consumer confidence fell again in July to 50.4 vs consensus 51.0 and previous 52.9. The drop was led by a fall in the expectations component. On the housing front, the May reading of the S&P Case-Shiller 20-city home price index showed a 3.9% rise year on year (vs 4.1% in April), and a 0.5% monthly gain (vs 0.6% in April). The residual impact of the tax credits continued to underpin house prices. But going into the second half of 2010, the theme of 'this is as good as it gets' will likely ring true in the housing market space also. The fundamentals point to sideways movement at best, and a fall at worst. Unemployment is still high, debt levels compared to house prices are still too high, consumers are still hurting, and interest rates are probably - if anything - going to rise, so this bit remains a key vulnerability for the US economic recovery.

4. Japan unemployment and deflation
Japan saw a slight easing of deflation on a headline CPI basis, with the annual rate at -0.7% in June vs -0.9% in May, on a core basis the rate also reduced slightly to -1.0% vs -1.2% in May and consensus for -1.1%. So on the deflation front there has been cause for at least a bit of hope with recent trends. On the unemployment side though, the jobless rate rose to 5.3% from 5.2% in May, but there were some positives in the data with payrolls rising 40k in June, vs a fall of -240k in May. The job offer to job seeker ration rose slightly to 0.52 in June from 0.50 in May. So signs are tentatively that inflation and employment are gradually starting to catch up with the trade-driven rebound of economic activity in Japan, but the serious deflation and government debt problems still remain, as do the global vulnerabilities.

5. New Zealand monetary policy
The RBNZ (Reserve Bank of New Zealand) increased the official cash rate at its July meeting 25bps to 3.00%, and signaled that further rate rises will likely be on the go-slow. The bank noted that policy normalization may be more moderate going forward, but of course with the caveat of monitoring the economic environment and financial market developments. The New Zealand economy is in recovery mode and is growing, but is still dealing with the damage from the global financial crisis and the deep recession; as well as a spate of finance company collapses, beginning prior to the crisis and still continuing (the banking system remains firmly intact though, as none of the finance companies were particularly systemically important - but a lot of investors got burned). So, in spite of a projected short term (mainly artificial) spike in inflation, the outlook is for a few more interest rate rises this year, as appropriate.

Summary

So we've got the US economy showing another quarter of growth, but a little slower, and the potential to slow even further in the second half. There's also the key vulnerability of the US housing market, and the lingering damage of the crisis on the US consumer.

In Korea, the economy is still going strong, albeit a little slower, and this is likely to result in a couple more interest rate rises. But the Korean economic recovery has been driven exports, thus the recovery remains exposed to trends in international trade. Likewise Japan is starting to see improvements in its employment and deflation situation as the economy recovers with the help of rising trade.

In New Zealand the same theme of global vulnerabilities shows through, but for the most part on the domestic front the recovery is reasonably in tact and both GDP, inflation and monetary policy look fairly predictable in the second half of this year - holding all else constant.

Sources
1. US Bureau of Economic Analysis www.bea.gov
2. OECD Statistics stats.oecd.org/index.aspx
3. Standard & Poors www.standardandpoors.com & Conference Board www.conference-board.org
4. Trading Economics www.tradingeconomics.com
5. Reserve Bank of New Zealand www.rbnz.govt.nz


Article Source: http://www.econgrapher.com/top5graphs31jul.html

Saturday, July 24, 2010

Economic Calendar - 26 July 2010

Here's the Economic Calendar for the week commencing the 26th of July 2010. This week the main event is Q2 GDP for the US, there's also the monthly GDP figure from Canada. The US also has the S&P Case-Shiller house price index, and consumer confidence. Elsewhere there's the RBNZ in New Zealand, which is expected to hike rates again. There's also a lot of key data out of Japan such as the jobless rate, retail sales, and industrial production; the Euro Zone also releases CPI and unemployment data.

(More commentary follows the table)

Day Time (GMT) Code Event/Release Forecast Previous
MON 1:30 AUD Producer Price Index (YoY) (2Q) 1.5% -0.1%
MON 12:30 USD Chicago Fed National Activity Index (JUN)
0.21
MON 14:00 USD New Home Sales (MoM) (JUN) 6.7% -32.7%
MON 14:00 USD New Home Sales (JUN) 320K 300K
TUE 8:00 EUR Euro-Zone M3 s.a. (YoY) (JUN) -0.1% -0.2%
TUE 13:00 USD S&P/Case-Shiller Composite-20 (YoY) (MAY) 3.75% 3.81%
TUE 13:00 USD S&P/Case-Shiller Home Price Index (MAY)
144.56
TUE 14:00 USD Consumer Confidence (JUL) 51.8 52.9
WED
EUR German Consumer Price Index (YoY) (JUL P) 1.2% 0.9%
WED 1:30 AUD Consumer Prices Index (QoQ) (2Q) 1.0% 0.9%
WED 1:30 AUD Consumer Prices Index (YoY) (2Q) 3.4% 2.9%
WED 3:00 NZD NBNZ Business Confidence (JUL)
40.2
WED 3:00 NZD NBNZ Activity Outlook (JUL)
38.5
WED 8:00 EUR ECB Publishes Bank Lending Survey

WED 12:30 USD Durable Goods Orders (JUN) 0.8% -1.1%
WED 12:30 USD Durables Ex Transportation (JUN) 0.5% 0.9%
WED 18:00 USD Fed Publishes Beige Book Economic Report

WED 21:00 NZD Reserve Bank of New Zealand Interest Rate Decision 3.00% 2.75%
WED 22:45 NZD Trade Balance (New Zealand dollars) (JUN) 368M 814M
WED 23:50 JPY Retail Trade s.a. (MoM) (JUN) 0.4% -2.0%
WED 23:50 JPY Retail Trade (YoY) (JUN) 3.2% 2.8%
THU 1:00 AUD HIA New Home Sales (MoM) (JUN)
-6.4%
THU 7:55 EUR German Unemployment Rate s.a. (JUL) 7.6% 7.7%
THU 9:00 EUR Euro-Zone Economic Confidence (JUL) 99.0 98.7
THU 9:00 EUR Euro-Zone Business Climate Indicator (JUL) 0.39 0.37
THU 23:01 GBP GfK Consumer Confidence Survey (JUL) -21 -19
THU 23:30 JPY Jobless Rate (JUN) 5.2% 5.2%
THU 23:30 JPY Household Spending (YoY) (JUN) -0.8% -0.7%
THU 23:30 JPY National Consumer Price Index (YoY) (JUN) -0.7% -0.9%
THU 23:50 JPY Industrial Production (YoY) (JUN P) 18.9% 20.4%
FRI 5:00 JPY Housing Starts (YoY) (JUN) 1.8% -4.6%
FRI 5:00 JPY Annualized Housing Starts (JUN) 0.759M 0.737M
FRI 9:00 EUR Euro-Zone CPI Estimate (YoY) (JUL) 1.8% 1.4%
FRI 9:00 EUR Euro-Zone Unemployment Rate (JUN) 10.0% 10.0%
FRI 12:30 CAD Gross Domestic Product (MoM) (MAY) 0.1% 0.0%
FRI 12:30 USD Gross Domestic Product (Annualized) (2Q A) 2.5% 2.7%
FRI 12:30 USD Personal Consumption (2Q A) 2.3% 3.0%
FRI 12:30 USD Employment Cost Index (2Q) 0.5% 0.6%
FRI 13:45 USD Chicago Purchasing Manager (JUL) 56.0 59.1
FRI 13:55 USD U. of Michigan Confidence (JUL F) 67.5 66.5
FRI 20:15 USD Bloomberg Financial Conditions Index (APR) (JUL)
-1
SAT 22:00 CNY Manufacturing PMI
52.1

Starting with the main event, the US economy is expected to show an annualised growth rate of 2.5% in the second quarter of 2010, which will be slightly lower than the previous 2.7%. As I've often pointed to, it's likely that the first half of 2010 will be as good as it gets for this year, with either slower or downright double-dip material showing up in the second half.

On the inflation front, we've got several countries reporting CPI figures; first up is Australia, which is expected to show an annual inflation rate of 3.4% for the second quarter (up from 2.9% in Q1). Japan is expected to show further deflation with -0.7% year on year (vs -0.9% in May). The EU is also expected to show a slight pick up, to 1.8% from 1.4%.

There's also several confidence indicator updates, there's the US with the conference board consumer confidence index; expected to slip further to 51.8 from 52.9, and at the end of the week there's also the University of Michigan consumer sentiment index which is expected to rise slightly to 67.5 from 66.5. There's also National Bank of New Zealand business confidence, EU economic confidence, and China PMI.

It's also generally a heavy data week for Japan and the US. The US has the Fed's Beige Book economic report out, and the updates on the US housing market continue with S&P Case Shiller home price index (along with new home sales the day before), durable goods orders, and personal consumption stats, so it will provide a good insight into where the US is tracking.

In Japan there's retail sales, the jobless rate, CPI, industrial production, and housing starts - so it will also be good to get an update on where the world's 3rd or 2nd (depending how you measure) largest economy.

So as always, have a great week, watch out for surprises, and stay tuned for updates...

Sources
DailyFX www.dailyfx.com/calendar
Forex Pros www.forexpros.com/economic-calendar/
Forex Factory www.forexfactory.com/calendar.php
Bloomberg www.bloomberg.com
+various statistics websites and central bank websites for verification


Article Source: http://www.econgrapher.com/26jul-calendar.html