The global financial crisis required massive stimulus measures to attempt to limit the damage. For the time being it appears to have worked (beyond the scope of this article). But on the fiscal sustainability front this has taken what was already a huge problem and, without right action, could set developed nations and (through the deadly force of contagion) the world on a course to the next crisis; called 'sovereign default'.
The consequences of inaction could well be financial ruin, and when governments go bankrupt; who bails them out? In the usual format, the following 5 graphs will be examined for insights as regards this issue. At the conclusion the options for developed nations will be listed, and the implications for those reading will be highlighted.
1. Fiscal Balances: Advanced versus Emerging Economies
The chart below, from the IMF, shows data back to the 70's, through most of history the norm was deficits (so we're not really dealing with a new phenomenon, but the dynamics have changed). The history was also that developed nations tended to have lower deficits than emerging nations (greater tax revenue base, less spending required on infrastructure, less volatility of leadership, etc).

The reality and forecast is that developed nations will likely be spending more time in deficits greater than those of emerging markets, this is partly due to better growth prospects. The interesting thing to note is how this ties in with the other part of the equation; government borrowing...
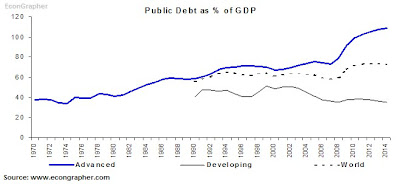
2. Public Debt: Advanced versus Emerging Economies
Generally as you spend money, sometimes you need to borrow, the idea is that you borrow a little, then pay it back. But as you will see below, the advanced economies missed the point and you have a steady climb in the level of public debt as a percentage of GDP. This is where it gets nasty. As with personal finances - if you find yourself with a large credit card balance, it's very difficult to get rid of it as more of your surplus income (if any) goes to paying interest rather than principal.

The same applies here, as debt increases, so does interest expense (and therefore the level of deficits), and well, (yes it has to be said...) as deficits increase, so too does borrowing! This is sometimes referred to as a vicious cycle - and is not reserved for over-leveraged consumers.
The last point to make is the emerging vs developed distinction; who's in the better fiscal position?
3. Fiscal Balances: The G7
In aggregation of data you lose detail, so lets look at the fiscal balance for the main G7 countries. The UK (and lesser so, the US) managed a brief period of surpluses, but as a group, unsurprisingly, spent most of their time in deficits. And Japan, in the red, with the higher deficit figures, is unsurprisingly also the one with the highest debt levels.

The key takeout from this chart is that if these nations go on, business as usual, debt levels will continue to climb, and external shocks like the financial crisis will cause stresses. The global financial crisis caused a blow out in deficits, which has caused borrowings to jump. So what? well, first of all - can debt levels keep growing forever? and second of all, if your credit card is maxed out, and you have an emergency, what do you do?
4. Government Debt: The Eurozone
Already, we've seen an example in the Eurozone in the form of Greece. The outlook is for further increasing debt levels. There is the backstop of the EU rules on government debt and fiscal balance limits, but still the pressures are building.

Driving much of the increase in Euro Area government debt is the UK. The UK has come out with a lot of damage following the crisis, and will have a hard time getting back to growth let alone a sustainable fiscal position. Indeed, in the next chart we'll see that the UK faces the largest gap between current deficits and where it needs to be to stop its debt
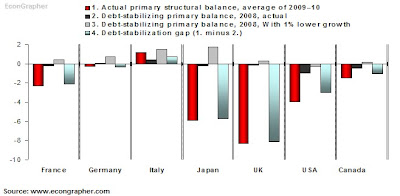
5. The Gap Between Spending and Borrowing
This graph shows analysis done by the IMF (with no. 4. as an extra calculation). It shows, in the red, actual primary structural balance, as a percentage of GDP, as you'd expect Japan, UK, US have the larger figures. The black and the gray are where it needs to be to stop debt from growing further (or stabilization).

Probing in further, the light blue bars show the gap between where the deficit is and where it should be to prevent further debt growth. These be large hurdles.
What are the options?
Staff at the IMF recently put out a paper on how to renormalize fiscal and monetary policy, for those with more than a passing interest, I suggest reading this. It outlines some of the options and consequences. But for a basic inventory:
a. Do Nothing: Carry on business as usual and hope for the best; this could work out over time if growth supports tax revenue and sees a lower deficit or surplus. But otherwise debt levels would continue to grow until lenders decided not to lend anymore. Interest rates would likely rise, and private sector will probably be crowded out. If debt got too high a credit rating downgrade could happen and catalyse a loss of confidence culminating in a currency, interest rate, and sovereign default crisis.
b. Print Money: Monetise the deficit, pay down your debt with printed money; this would reduce debt levels, but the cost would be increased inflation. At the extreme there would be hyperinflation, and very high nominal interest rates. The problem is, it's really a bad look if a developed economy starts to look like a Zimbabwe.
c. Cut Spending & Raise Taxes: Fiscal discipline is a good recipe for for lowering deficits, and perhaps finding your way into surpluses and therefore chipping away at government borrowing levels. The cost? a pretty significant drag on growth. Let's face it, you'd need pretty significant tax hikes and spending cuts for places like the US and UK. The growth outlook is already reasonably subdued, so if you add this, things don't look pretty.
What are the implications?
The consequences of the scenarios above require adjustments to strategy. For example if "a." was the option then you could just carry on as usual too, and hope that the sky doesn't fall - or you could carry on as usual but think about options to hedge against the worst case scenario of a developed economy sovereign debt crisis.
For the debt monetization option, obviously you'd need to think about inflation hedges such as real estate and commodities. You'd also have to think about where best to keep your currency (inflation is another way of saying a weakening currency).
For the final option, this would probably feed into asset allocation decisions on a country basis. The main consequence in the short term would be lower growth, so on a macro basis you'd look for places where growth may be higher in the near term. Though, longer term as debt levels were contained, growth levels would probably return in developed nations.
Overall, there is a problem in terms of fiscal sustainability and government borrowing in most of the major developed economies. The key is to understand the issues and implications so that you can vote politically in the right way (though maybe this is optimistic), and more importantly you can vote with your money in the right way.
Sources:
1. IMF World Economic Outlook http://www.imf.org/external/pubs/ft/weo/2009/02/index.htm
2. IMF World Economic Outlook http://www.imf.org/external/pubs/ft/weo/2009/02/index.htm
3. OECD Economic Outlook http://www.oecd.org/document/61/0,3343,en_2649_34573_2483901_1_1_1_1,00.html
4. OECD Economic Outlook http://www.oecd.org/document/61/0,3343,en_2649_34573_2483901_1_1_1_1,00.html
5. IMF World Economic Outlook http://www.imf.org/external/pubs/ft/weo/2009/02/index.htm
Article Source: http://econgrapher.site1.net.nz/fiscal30dec.html
EDIT/APPENDIX:
A commenter on Seeking Alpha pointed out the omission of Canada as being unfortunate given the example that it sets in terms of sustaining a surplus and showing fiscal discipline. To see the article on Seeking Alpha go here: http://seekingalpha.com/article/180278-developed-economies-fiscally-sustainable
The purpose of this article was to point to the key risk areas and inform strategy. But the comments are worthy of thought and I include the charts below with the Canada data added:
Chart 3. Fiscal Balances (G7)
 Chart 5. Spending/Borrowing Gap
Canada: Fiscal Balance (IMF Data)
This chart shows that Canada has broadly speaking run surpluses through the better part of the past decade. IMF forecasts are for a significant turnaround to deficits (likely driven by implications of the recession/crisis). The impact on Canadian government borrowing can be seen in the next chart...

Canada: Government Borrowings (IMF Data)
Unsurprisingly Canada's government debt peaked around the time that it started generating fiscal surpluses, and since then has been on a steady downward track.
 Ultimately the other developed economies probably want to find themselves on a similar path - and to a certain extent the borrowings/deficits will be somewhat self limiting in that at a certain arbitrary threshold it will become a hot political issue - then doing the right thing will become fashionable and there may be some short-medium term action towards it. Ultimately also market forces will weigh in on fiscal profligacy!


No comments:
Post a Comment
What do you think?